Polygon (MATIC/USD) Market Convergence Lengthens at $0.90
Estimated Reading Time: 3 minutes
Don’t invest unless you’re prepared to lose all the money you invest. This is a high-risk investment and you are unlikely to be protected if something goes wrong. Take 2 minutes to learn more
Polygon Price Prediction – December 11
There have been fewer price actions in the MATIC/USD trade operations as the crypto market convergence lengthens around the $0.90 line over a couple of sessions. Buying and selling activities are at $0.908, maintaining a 0.11 percentage rate.
MATIC/USD Market
Key Levels
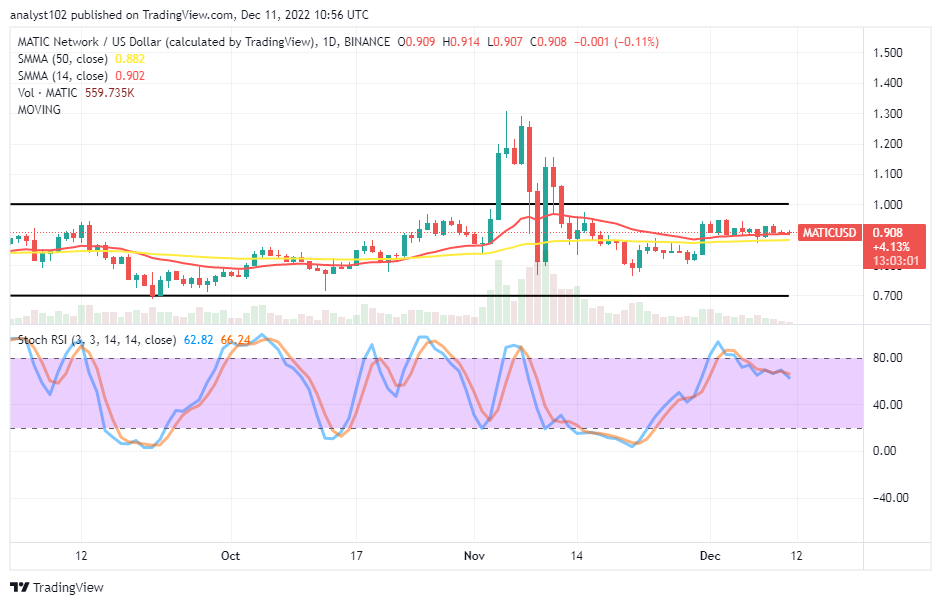
Resistance levels: $1, $1.10, $1.20
Support levels: $0.75, $0.70, $0.65
MATIC/USD – Daily Chart
The MATIC/USD daily chart showcases the crypto-economic market convergence lengthens around the $0.90 level within the range-bound spots. Near the $0.882 mark of the 50-day SMA indicator, the 14-day SMA indicator is at $0.902. The Stochastic Oscillators have been craving a modest southward swerve from the overbought zone to 66.24 and 62.82. levels. That suggests that recent market activity has been somewhat negatively compliant.
What is the most likely direction the MATIC/USD market will take under the upcoming erratic price movements?
At the moment, it appears that the MATIC/USD would still have to run for a line of corrections below its current trading spot to let bulls maximally garner the required energy to get reshaped back to surging highs. Nevertheless, the current pace of price motion has not had an attraction toward getting a reliable entry to catapult buying positions into a profit-making cycle. As a result, bulls must continue to adhere to the standard trading decency guideline, which discourages order entry at an inappropriate time.
On the negation pathway to the upside of the technical analysis, much selling pressures have to hold firmer in the current wake of price trying to push southward in the confluence trading axis. An aggressive re-occurrence in the MATIC/USD trade bulls against the points of $0.90 and the upper range line will negate the possibility of the price moving back to a downward trend at an early stage.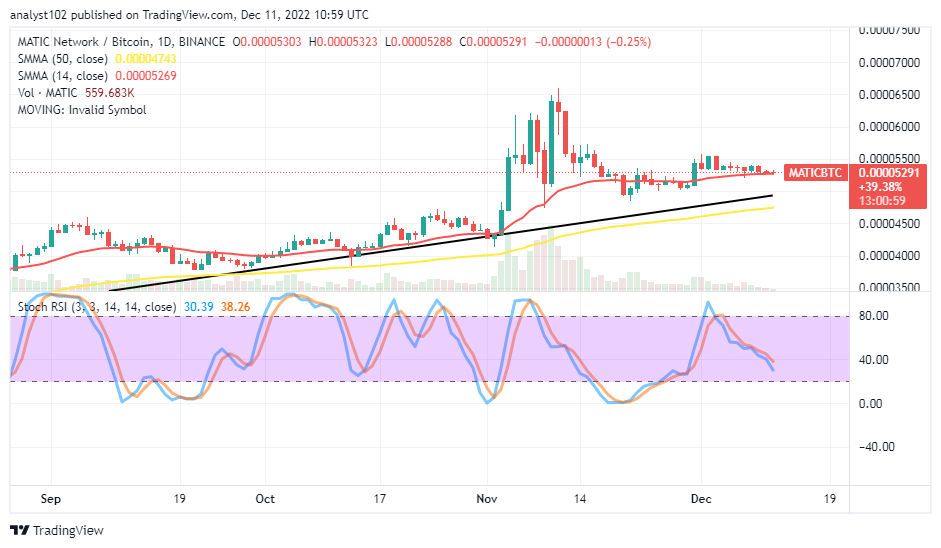
MATIC/BTC Price Analysis
In comparison, although there has been a chain of price retracement in the pairing crypto as Polygon possesses positions closely around the trend line of the smaller SMA against Bitcoin. Compared to the 50-day SMA indicator, the 14-day SMA indication is higher. And they are pointed in the direction of the north. The Stochastic Oscillators have moved southward to levels 38.26 and 30.39 from the overbought region to indicate a relative falling force ongoing.
Note: Cryptosignals.org is not a financial advisor. Do your research before investing your funds in any financial asset or presented product or event. We are not responsible for your investing results.
You can purchase Lucky Block here. Buy LBLOCK