Tamadoge (TAMA/USD) Holds Steady at $0.00091, Eyeing Potential Rebound
Estimated Reading Time: 3 minutes
Don’t invest unless you’re prepared to lose all the money you invest. This is a high-risk investment and you are unlikely to be protected if something goes wrong. Take 2 minutes to learn more
Tamadoge (TAMA/USD) continues to consolidate around the $0.00091 support level, as bulls hold firm against persistent bearish pressure. Repeated rejections at this price point highlight the strength of buying interest and the commitment of bulls to defend the zone.
This level has emerged as a critical support area, with buyers consistently regrouping whenever the market retests it. The sustained consolidation suggests a potential exhaustion of bearish momentum, which could eventually pave the way for a bullish breakout from this range.
Key Levels to Watch
- Resistance Zones: $0.00045, $0.00050, $0.00055
- Support Zones: $0.00009, $0.00008, $0.00007
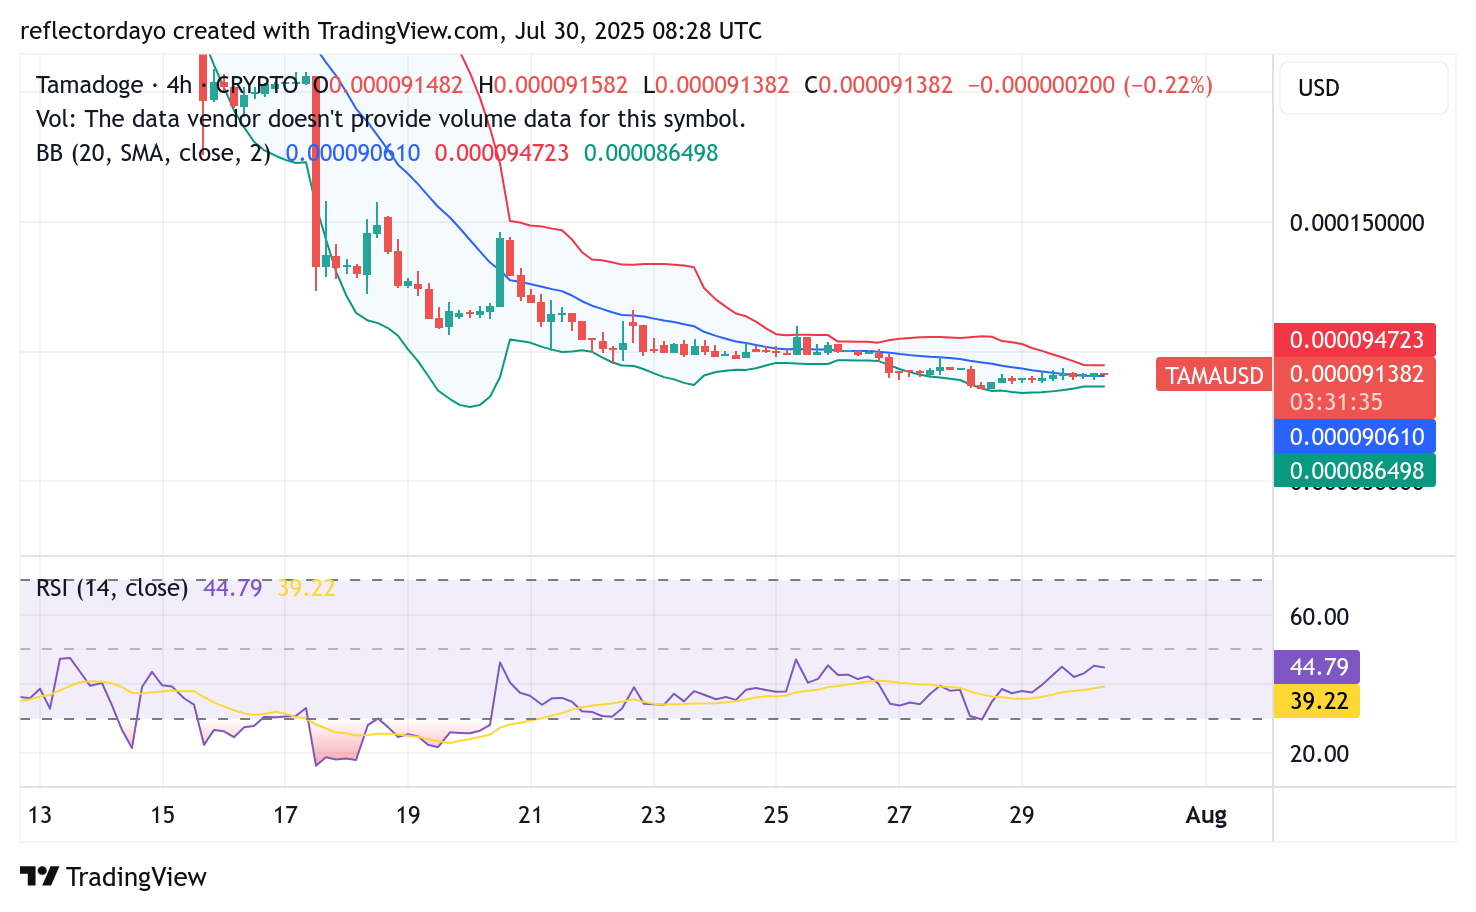
Tamadoge (TAMA/USD) 4-Hour Chart: Signs of Bullish Resilience Despite Ongoing Consolidation
On the 4-hour chart, Tamadoge (TAMA/USD) initially showed strength at the $0.0001 support level, holding off bearish pressure. Although the price has since gradually declined to the $0.00009 region, the slow pace of the descent reflects lingering bullish sentiment in the market.
This underlying resilience in the crypto signal was further evident in the slight rebound observed from the $0.00009 level. However, the limited strength of the recovery suggests that the market remains in a consolidation phase, with neither side gaining clear dominance for now.
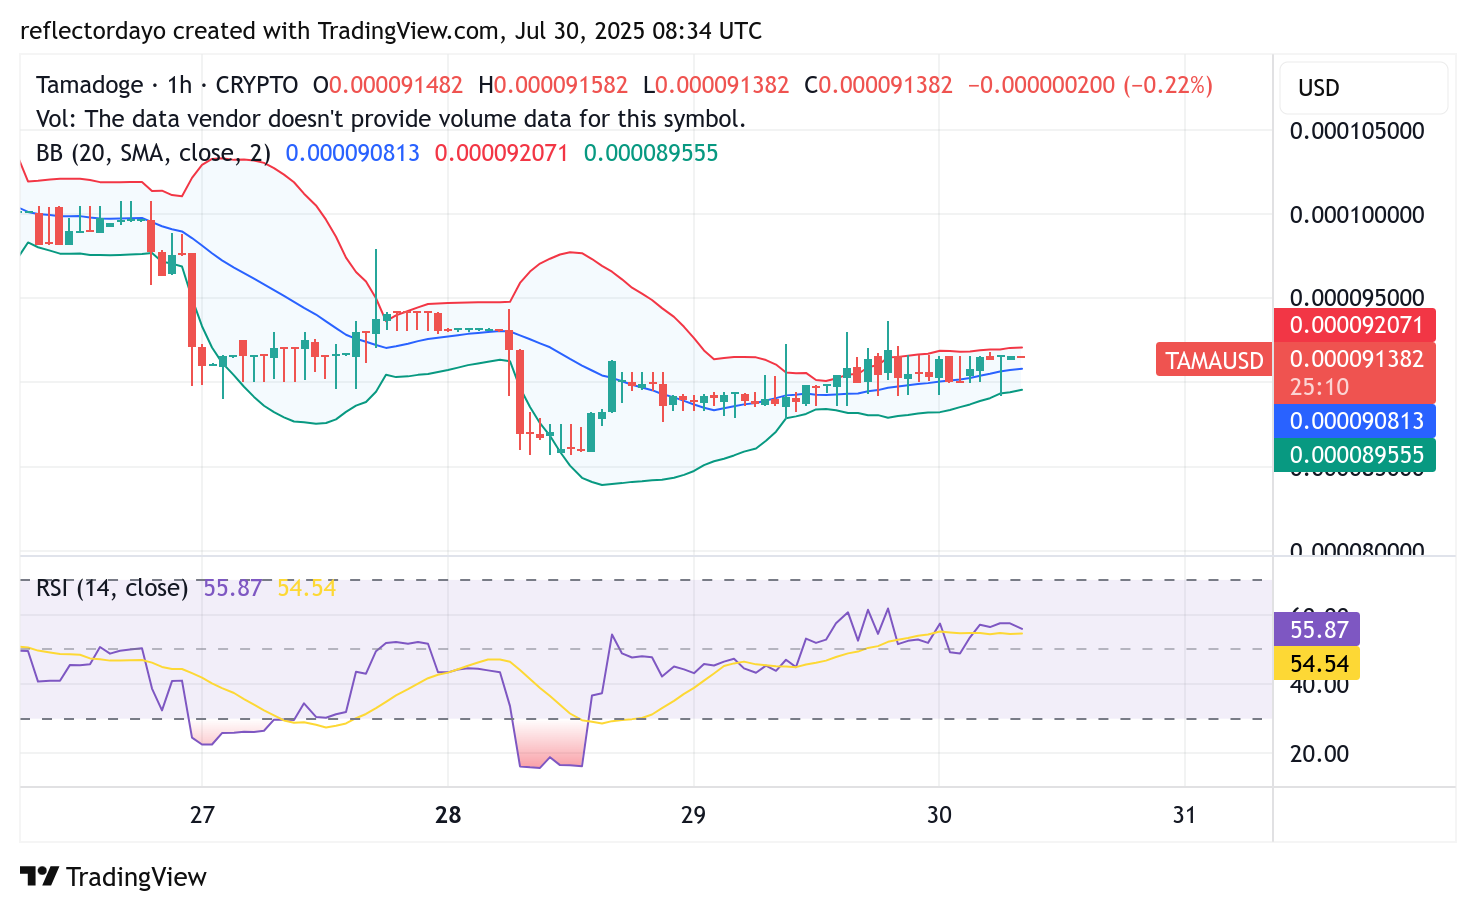
Tamadoge (TAMA/USD) 1-Hour Chart: Early Signs of Momentum Amid Ongoing Stalemate
While the 4-hour chart shows a broader consolidation near the midpoint, the 1-hour chart reveals a subtle upward tilt in price action, with TAMA/USD now trading above the 20-period moving average. This suggests a potential shift in short-term momentum.
However, the appearance of two consecutive four-price doji candlesticks in the most recent sessions highlights indecision in the market, as buying and selling pressures reach a temporary equilibrium around the $0.0000915 level. The next few trading sessions will be crucial in determining whether the market breaks out of this stalemate.
Buy Tamadoge!
There’s no mobile runner out there quite like #TamadogePursuit! 🏃♂️
1️⃣ Sign up – start with 20 free credits for a boost!
2️⃣ Climb up the leaderboards.
3️⃣ Win $TAMA rewards!Play Now! 👇
📱Android: https://t.co/Of8SYALRzL
📱 iOS: https://t.co/IthvqovwAH pic.twitter.com/84HNqob9Rf— TAMADOGE (@Tamadogecoin) September 10, 2024