Uniswap (UNI) Price Prediction: UNI/USDT Refocuses on the $8.00 Mark
Estimated Reading Time: 3 minutes
Don’t invest unless you’re prepared to lose all the money you invest. This is a high-risk investment and you are unlikely to be protected if something goes wrong. Take 2 minutes to learn more

Uniswap (UNI) Price Prediction – July 3, 2025
The Uniswap market recently experienced a strong upward rebound off the $6.00 support level. Since then, the market has remained afloat, followed by another recent bullish push. This has kept the token trading above key technical levels that may signal further price increases.
UNI/USDT Long-Term Trend: Bullish (Daily Chart)
Key Price Levels:
Resistance: $8.00, $9.00, $10.00
Support: $7.00, $6.00, $5.00
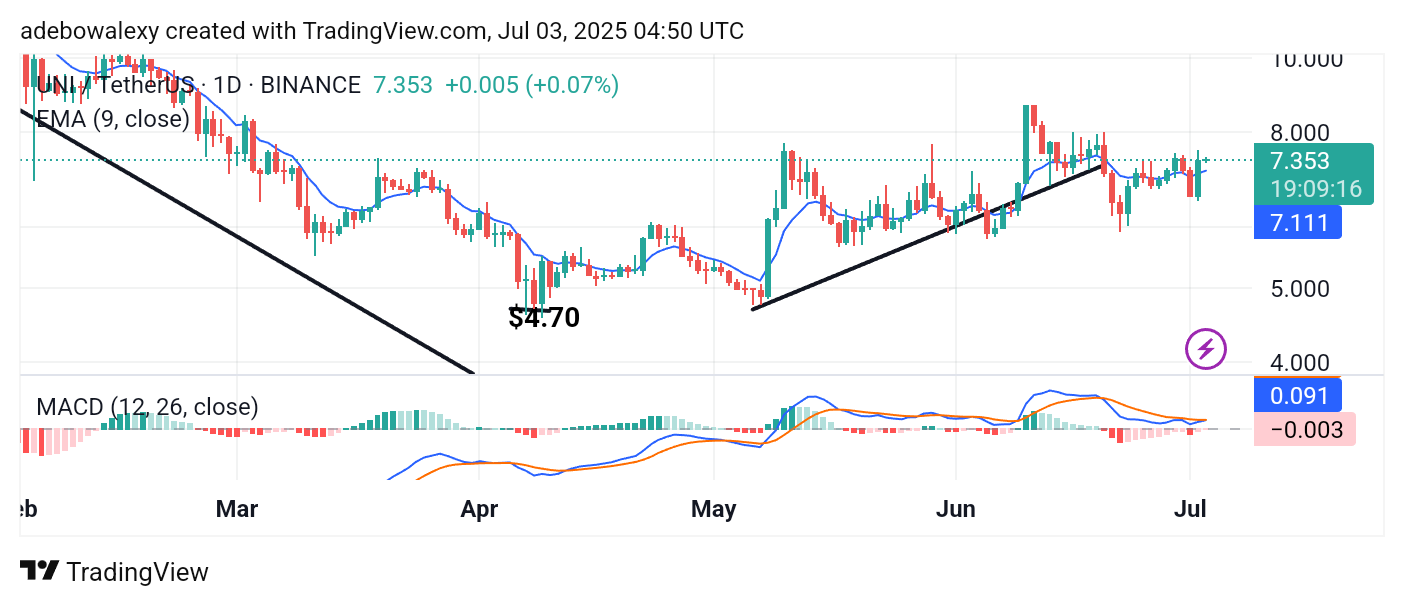
Price action in the Uniswap daily market has continued its recently acquired upward trajectory. The previous session produced a strong bullish rebound, and the current session has also formed a green price candle. Notably, the latest candle appears above the 9-day Exponential Moving Average (EMA) line. Additionally, the Moving Average Convergence Divergence (MACD) lines are converging above the equilibrium level, suggesting a potential upward crossover.
UNI/USDT Market Eyes Further Price Increases
With the appearance of the latest price candle on the Uniswap daily chart, bullish momentum seems likely to drive further upward movement. The previous session was particularly gainful, as indicated by the size of its corresponding candle. While a minor pullback might have been expected, the current session suggests that the market may be ready to maintain its upward course.
At this point, the token is trading above the 9-day EMA line. Likewise, the MACD indicator lines are converging for a potential upward crossover, and this convergence is occurring above the equilibrium level—indicating the possibility of increasing momentum.
UNI/USDT Bulls Show Persistence (4-Hour Chart)
While the daily chart has shown consistent bullishness since the previous session, the 4-hour chart also suggests that bulls are regaining control. Based on the last three price candles, the previous two sessions produced a slight downward retracement. However, the ongoing session has formed a green candle, indicating that buying activity is resuming.
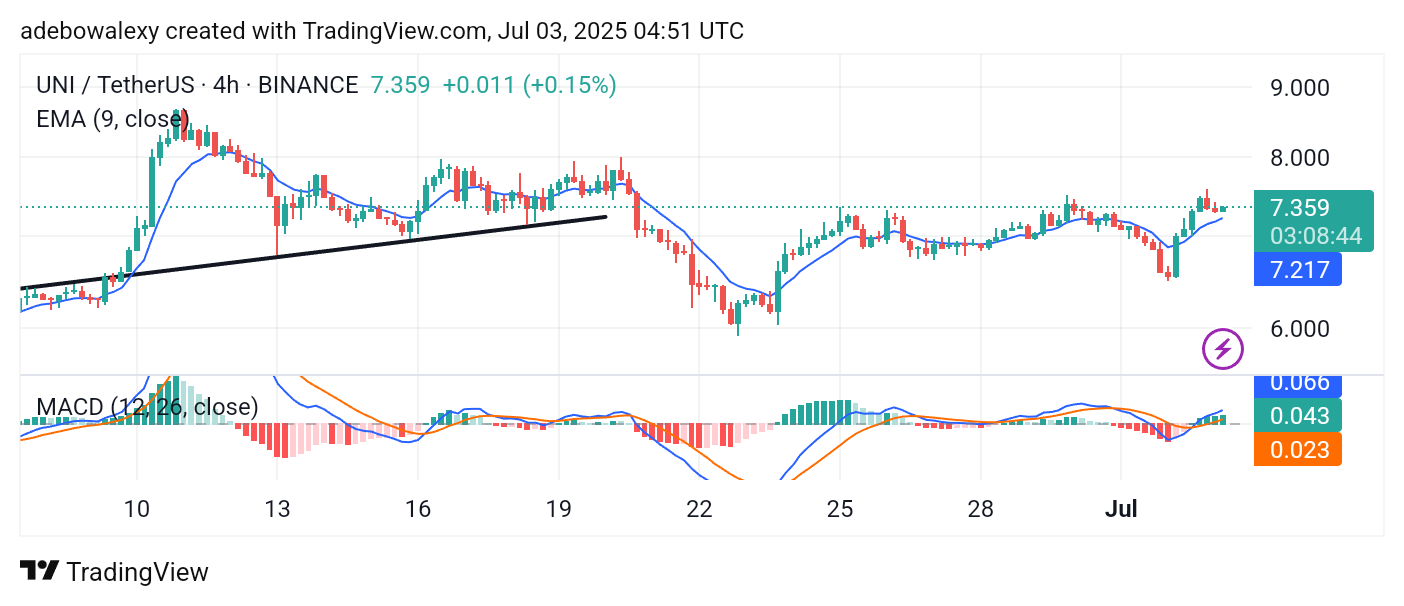
All of this is occurring above the 9-day EMA curve, further confirming bullish sentiment. Additionally, the MACD lines continue rising above the equilibrium level, and the histogram bars remain solid green—affirming that upward forces are likely to keep pushing the market toward the $8.00 price level.