Bitcoin (BTC) Price Prediction: BTC/USDT Shows No Short-Term Surprises
Estimated Reading Time: 3 minutes
Don’t invest unless you’re prepared to lose all the money you invest. This is a high-risk investment and you are unlikely to be protected if something goes wrong. Take 2 minutes to learn more

Bitcoin (BTC) Price Prediction – July 2, 2025
The Bitcoin market has continued to trade within the price range of $102,000 to $112,000. This range has been in play for a while, and the market hasn’t breached it. However, the market currently appears to be on an upward path—let’s see what may become of it shortly.
BTC/USDT Long-Term Trend: Bullish (Daily Chart)
Key Price Levels:
Resistance: $107,000, $110,000, $113,000
Support: $104,000, $100,000, $96,000
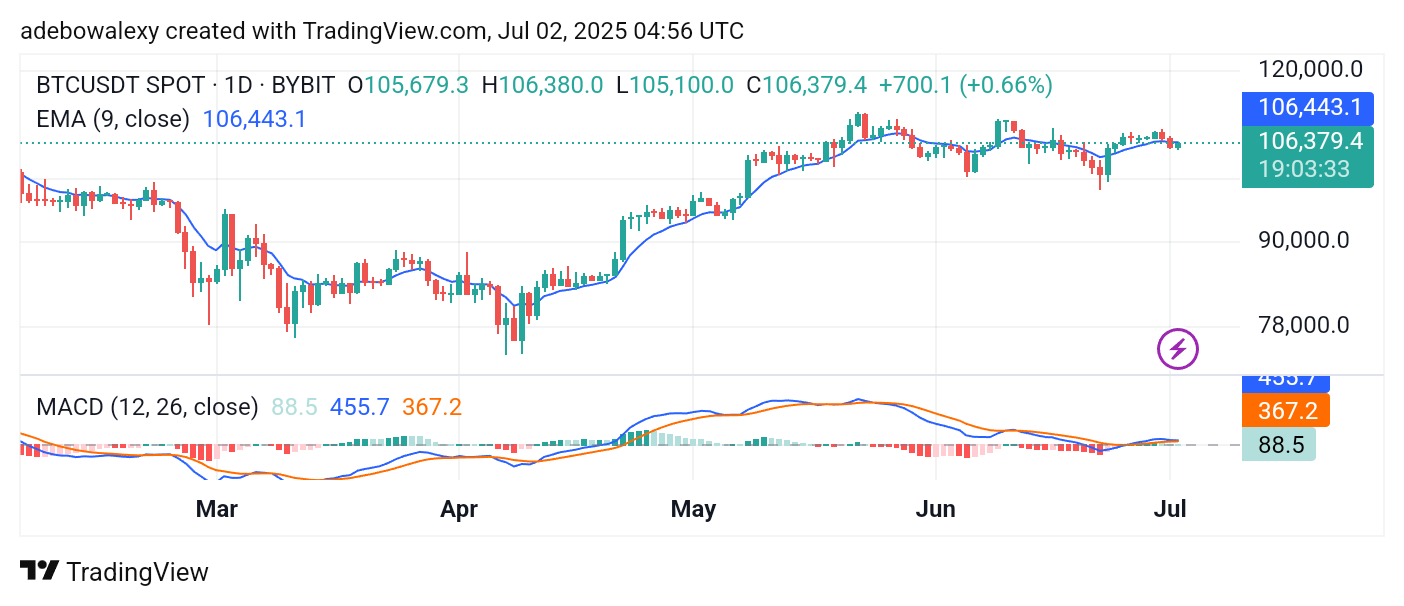
Price action on the Bitcoin daily chart has continued to range between the wide price levels of $112,000 and $102,000 for some time. Meanwhile, the most recent price candle on the chart is testing the 9-day Exponential Moving Average (EMA) line as resistance.
However, the lines of the Moving Average Convergence Divergence (MACD) indicator have risen past the equilibrium level. The MACD lines remain above the equilibrium line but appear merged, showing little clear direction at this point.
Bitcoin (BTC) Price Prediction: BTC/USDT Still Looks Suppressed
Price action in the Bitcoin market continues to hover around the 9-day EMA line. However, the ongoing session stands below this technical level despite a bullish appearance. This, in contrast to the bullish sentiment, suggests that the market may descend lower.
The characteristics of the MACD indicator also don’t point to a brighter outlook. This impression stems from the fact that the MACD lines are merged and moving largely sideways, even though they remain slightly above the equilibrium level.
Bitcoin (BTC) Price Prediction: BTC/USDT Stays Challenged (4-Hour Chart)
The corresponding price candle for the ongoing session on the Bitcoin 4-hour chart is a green one, consistent with the daily chart. However, it appears to be testing the resistance formed by the 9-day EMA line.
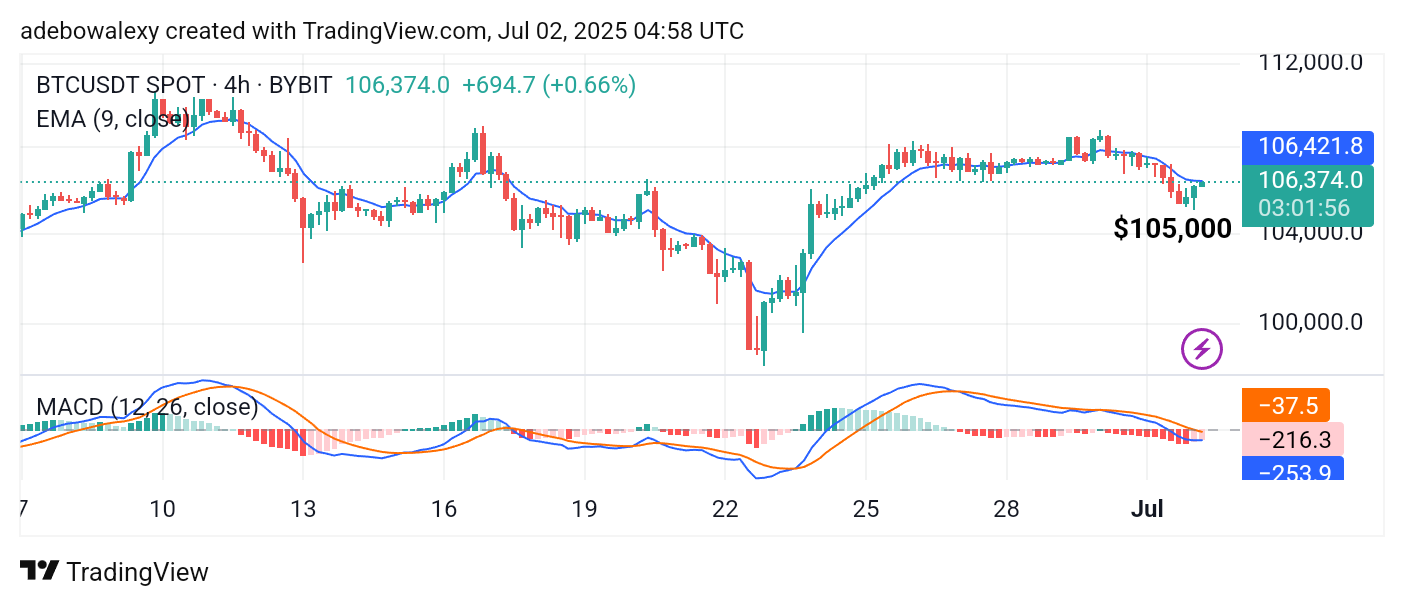
Likewise, the MACD indicator lines have fallen below the equilibrium level but have recently shaped toward a crossover. The last bar of the histogram is now pale red, aligning with the observed upward rebound. Nevertheless, traders might want to wait for price action to cross above the 9-day EMA line before taking bullish positions targeting the $109,000 level.