Litecoin (LTC) Price Prediction: LTC/USDT Bounces Back but Hovers Above Key Levels
Estimated Reading Time: 3 minutes
Don’t invest unless you’re prepared to lose all the money you invest. This is a high-risk investment and you are unlikely to be protected if something goes wrong. Take 2 minutes to learn more
Litecoin (LTC) Price Prediction – July 1, 2025
The Litecoin market has managed to bounce back from a significant dip. However, since the recovery, price action has struggled to make further bullish progress. Let’s take a closer look at the token’s price movement below.
LTC/USDT Long-Term Trend: Bullish (Daily Chart)
Key Price Levels:
Resistance: $90, $95, $100
Support: $80, $75, $70
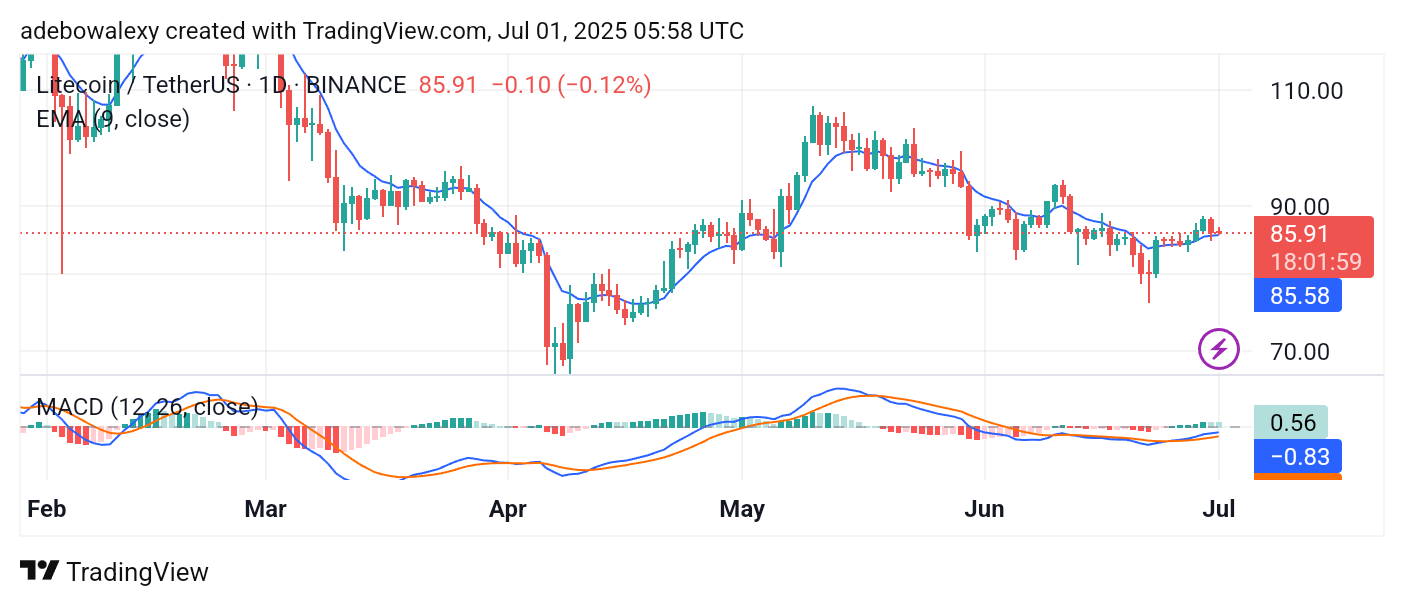
Price action in the Litecoin market has been hovering just above the 9-day Exponential Moving Average (EMA) line recently. Also, the last price candle on the chart appeared red, bringing the market closer to the 9-day EMA. Meanwhile, the Moving Average Convergence Divergence (MACD) indicator lines are below the equilibrium level but maintain a slight upward trajectory. Despite the bearish appearance of the most recent candle, the MACD histogram bars are still above the equilibrium line, suggesting that some bullish momentum remains.
Litecoin (LTC) Price Prediction: Is the Downward Retracement in the LTC/USDT Market Easing?
As mentioned above, price action in the Litecoin market remains above the 9-day EMA line. Meanwhile, the market has been experiencing a slight decline since the previous session. However, the current session shows minimal progress in that direction, as price action remains above the 9-day EMA due to the small size of the ongoing session’s candle.
In addition, the MACD indicator line retains its slight upward slope, even though it remains below the equilibrium level. Based on these signals, it appears the market may not see a further significant downward retracement.
Litecoin (LTC) Price Prediction: LTC/USDT Continues to Oscillate Around the 9-Day EMA (4-Hour Chart)
On the 4-hour chart, Litecoin’s price action continues to follow a generally sideways trajectory. Most recent candles have oscillated around the 9-day EMA line. However, the latest candle has brought the market just below the EMA line.
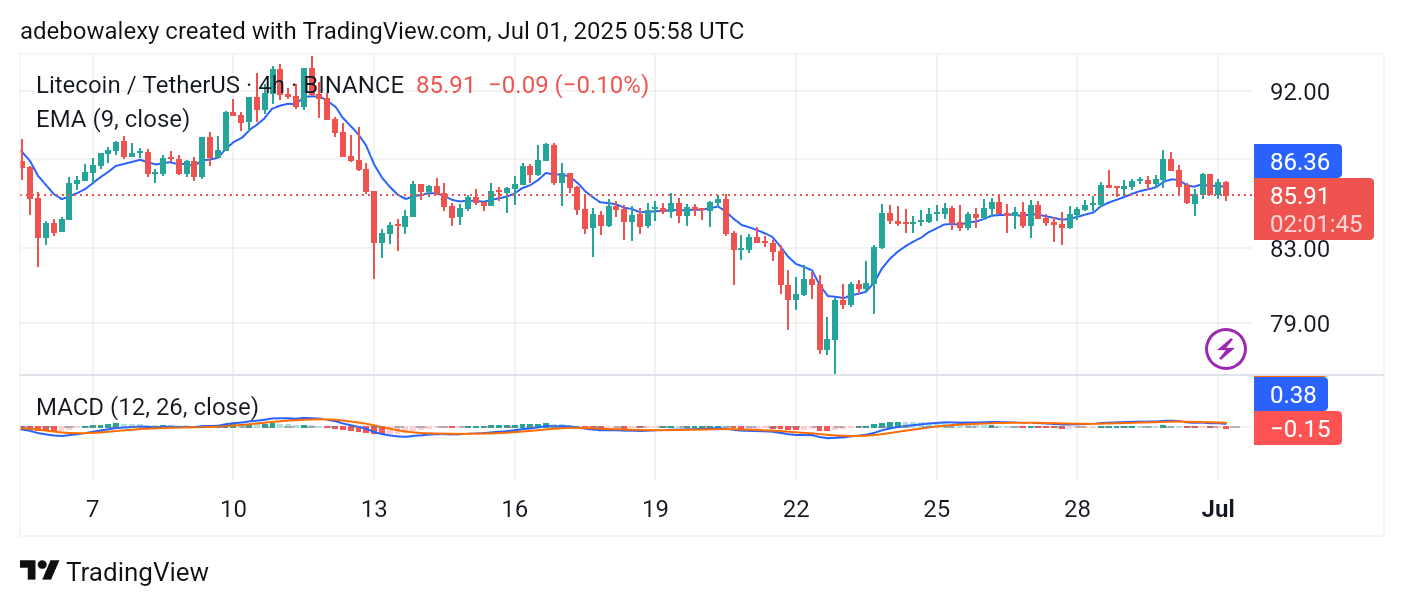
At the same time, the MACD indicator lines remain almost flat, moving sideways above the equilibrium level. The current candle also has a lower shadow, suggesting that bullish forces may be emerging. This could potentially propel price action toward the $85 or $87 price levels in the short term.