$SPONGE (SPONGE/USD): A Tug-of-War with Bulls and Bears
Estimated Reading Time: 2 minutes
Don’t invest unless you’re prepared to lose all the money you invest. This is a high-risk investment and you are unlikely to be protected if something goes wrong. Take 2 minutes to learn more

The SPONGE/USD market has been experiencing a tense battle between bullish and bearish forces. Despite a volatile market environment, SPONGE has shown resilience, repeatedly testing the $0.000034 resistance level. This crucial price point has served as a formidable barrier, preventing significant upward price movements since September 6th. However, bullish sentiment remains strong, with support levels gradually rising closer to the resistance.
Key Market Dynamics:
- Resistance Levels: $0.0010, $0.0011, $0.0012
- Support Levels: $0.000020, $0.0000195, $0.000019

$SPONGE (SPONGE/USD) Technical Outlook
The Bollinger Bands on the SPONGE/USD chart have been widening, indicating significant price fluctuations. While downward movements have dominated recently, a potential contraction in the bands could offer a window of opportunity for bulls to establish a stronger price base and challenge the $0.000034 resistance.
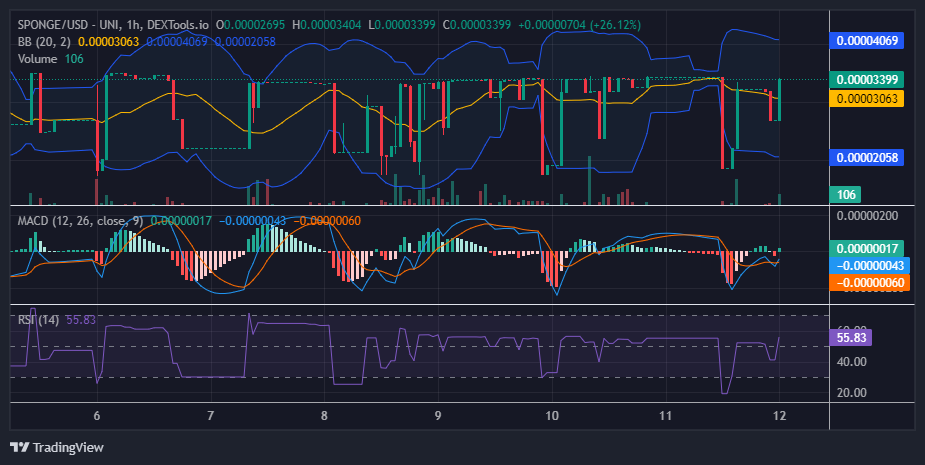
$SPONGE 1-Hour Chart Insights
A closer look at the 1-hour chart reveals ongoing market volatility. The Bollinger Bands have widened again as bullish momentum pushed the price towards the $0.000034 resistance. Despite previous downward price swings, there are signs of a potential upward breakout. If the crypto signal of the SPONGE/USD market can successfully breach this level, the next significant price target could be $0.00004.
Buy $SPONGE!
Give us that damp 💦 $SPONGE pic.twitter.com/5MfwcNVL6d
— $SPONGE (@spongeoneth) September 8, 2024
Join the SPONGE community and be part of the next big crypto sensation! Buy Sponge ($SPONGE) today!