$SPONGE (SPONGE/USD) on the Brink of a Breakout
Estimated Reading Time: 2 minutes
Don’t invest unless you’re prepared to lose all the money you invest. This is a high-risk investment and you are unlikely to be protected if something goes wrong. Take 2 minutes to learn more

Despite a volatile market, the $SPONGE market has shown remarkable resilience. Currently, it’s testing the bearish resistance level at $0.000034. This resistance has held since September 6, with bears effectively halting any upward price swings. However, bullish forces have remained persistent, according to the crypto signal from the 4-hour chart, with the lows gradually rising closer to the $0.000034 level.
Key Market Dynamics:
- Resistance Levels: $0.0010, $0.0011, $0.0012
- Support Levels: $0.000020, $0.0000195, $0.000019
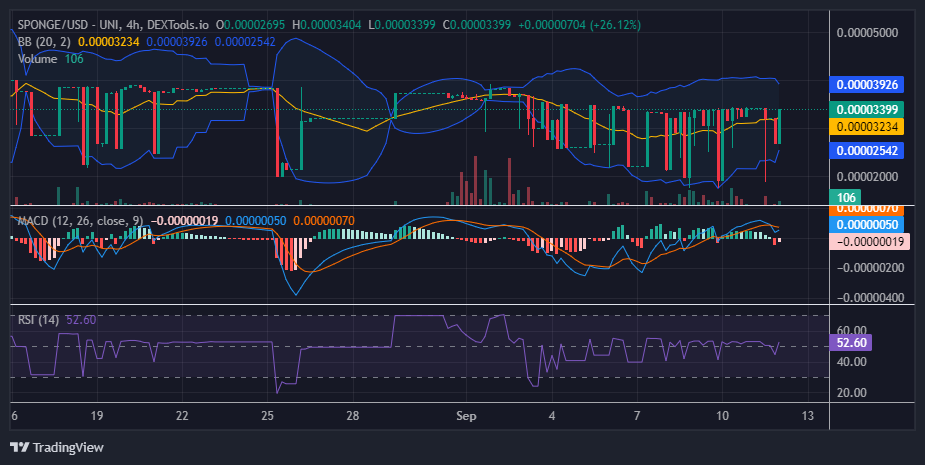
$SPONGE (SPONGE/USD) Technical Outlook
The volatile market environment has made it difficult for $SPONGE to break through the crucial $0.000034 resistance level. As indicated by the Bollinger Bands, the wide bandwidth suggests significant price fluctuations, with downward swings outpacing upward movements. However, a recent contraction in the Bollinger Bands may present an opportunity for bullish forces to establish a stable price base and potentially challenge the $0.000034 resistance level.
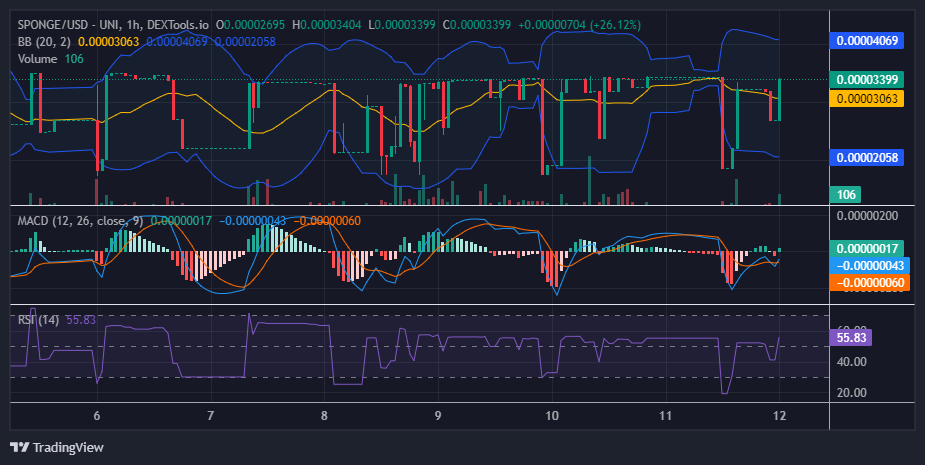
$SPONGE (SPONGE/USD) 1-Hour Chart Insights
Analyzing the 1-hour chart, market volatility persists. The Bollinger Bands have recently widened again as bullish momentum pushed the price towards the critical $0.000034 level. Despite previous downward price swings, the market is now showing signs of a potential upward break through this resistance. If a breakout occurs, the next significant price target could be $0.00004.
Buy SPONGE/USD!
Give us that damp 💦 $SPONGE pic.twitter.com/5MfwcNVL6d
— $SPONGE (@spongeoneth) September 8, 2024
Join the SPONGE community and be part of the next big crypto sensation! Buy Sponge ($SPONGE) today!