Litecoin (LTC) Price Prediction: LTC/USDT Recovers, Charges Toward the $110 Price Level
Estimated Reading Time: 3 minutes
Don’t invest unless you’re prepared to lose all the money you invest. This is a high-risk investment and you are unlikely to be protected if something goes wrong. Take 2 minutes to learn more

Date: May 13, 2025
The Litecoin market has been on a steady upward retracement since Bitcoin began regaining prominence. As a result, the token now trades above the $100 price level per coin. Let’s explore how this market may develop further.
LTC/USDT Long-Term Trend: Bullish (Daily Chart)
Key Price Levels:
Resistance: $110, $120, $140
Support: $100, $90, $80
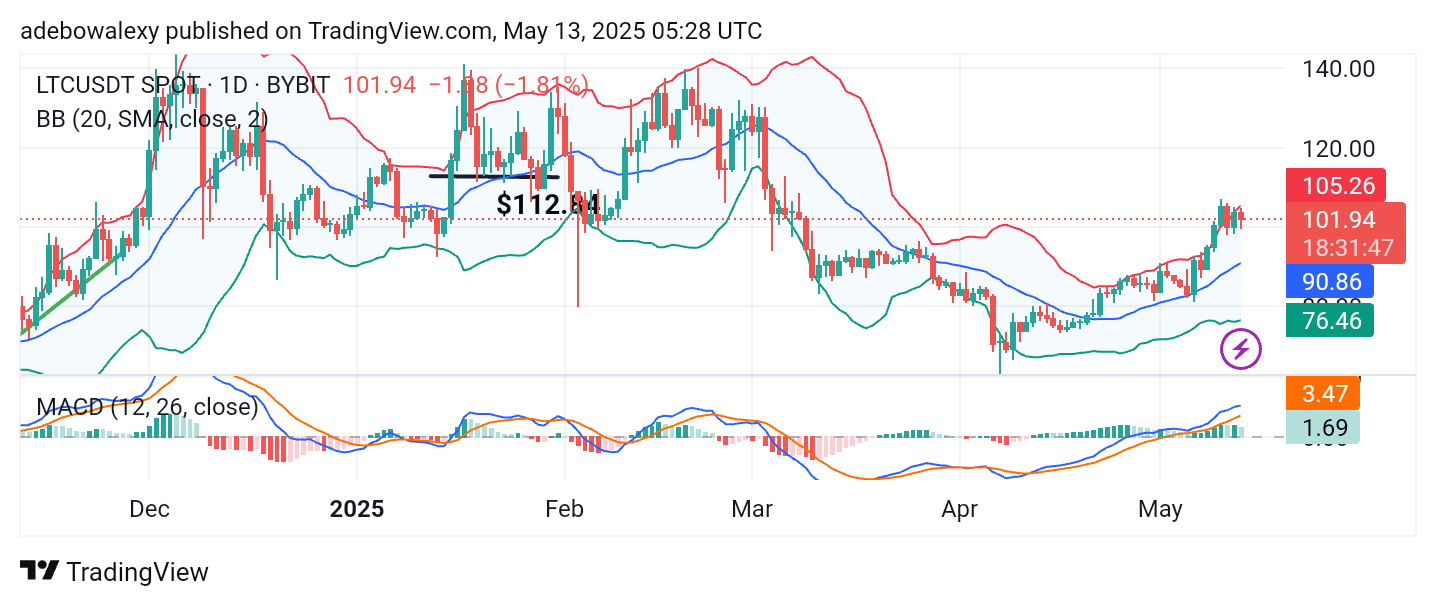
The Litecoin market has been steadily retracing toward higher price levels in recent days. However, the ongoing consolidation has led to a brief pause in the upward movement, following an extended period of hugging the upper band of the Bollinger Bands indicator. The most recent daily price candle is red but remains near the upper Bollinger Band. Additionally, the Moving Average Convergence Divergence (MACD) indicator continues to trend upward after crossing above the equilibrium level. However, the latest histogram bar is pale green, suggesting a potential slight downward deflection in the current session.
Litecoin (LTC) Price Prediction: LTC/USDT Temporary Pause May Break Soon
The current session in the Litecoin daily chart has introduced a temporary pause in the uptrend. Based on indicator signals, it appears likely that the upward retracement may resume. Price action remains concentrated near the upper band of the Bollinger Bands.
Similarly, the MACD lines maintain an upward trajectory after crossing above the equilibrium level. These factors continue to align and suggest that bullish momentum remains dominant and may push prices further upward in this market.
Litecoin (LTC) Price Prediction: LTC/USDT Is Gaining Momentum
The daily chart suggests that a period of consolidation is occurring. However, the 4-hour chart reveals clearer signs of an upward rebound. This is evident in the latest green price candle, which has pushed the market back above the middle Bollinger Band.
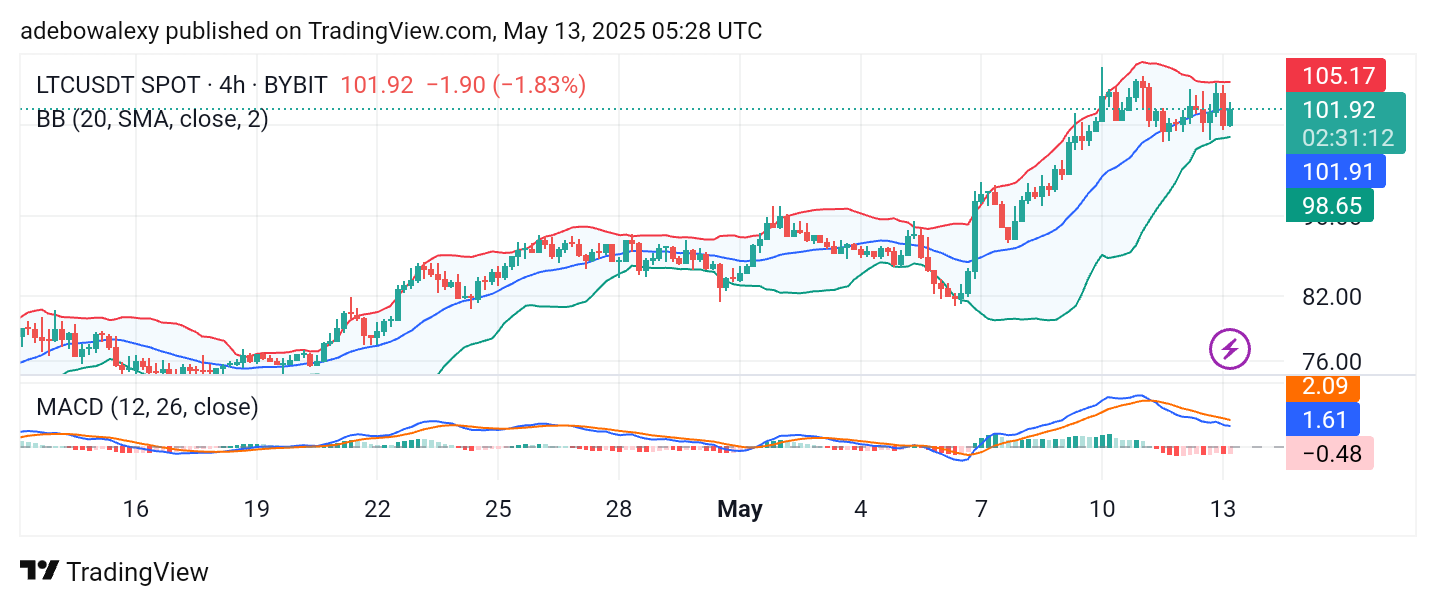
Meanwhile, the MACD lines are positioned above the equilibrium level, although they show a slight downward slope. At the same time, the most recent histogram bar appears pale red, indicating a potential resurgence in bullish momentum. As a result, price action may soon push toward the $110 resistance level.