Dogecoin (DOGE) Price Prediction: DOGE/USDT Recovers, Charges Toward the $0.3000 Price Level
Estimated Reading Time: 3 minutes
Don’t invest unless you’re prepared to lose all the money you invest. This is a high-risk investment and you are unlikely to be protected if something goes wrong. Take 2 minutes to learn more

Date: May 12, 2025
The Dogecoin market has been experiencing a massive recovery lately. The price has been progressing from one high to another. The most recent surge, which occurred over the past four sessions, was the most rapid and significant. More details about the recent and potential future direction of this trend are discussed below.
DOGE/USDT Long-Term Trend: Bullish (Daily Chart)
Key Price Levels:
Resistance: $0.3000, $0.3500, $0.4000
Support: $0.2500, $0.2000, $0.1500
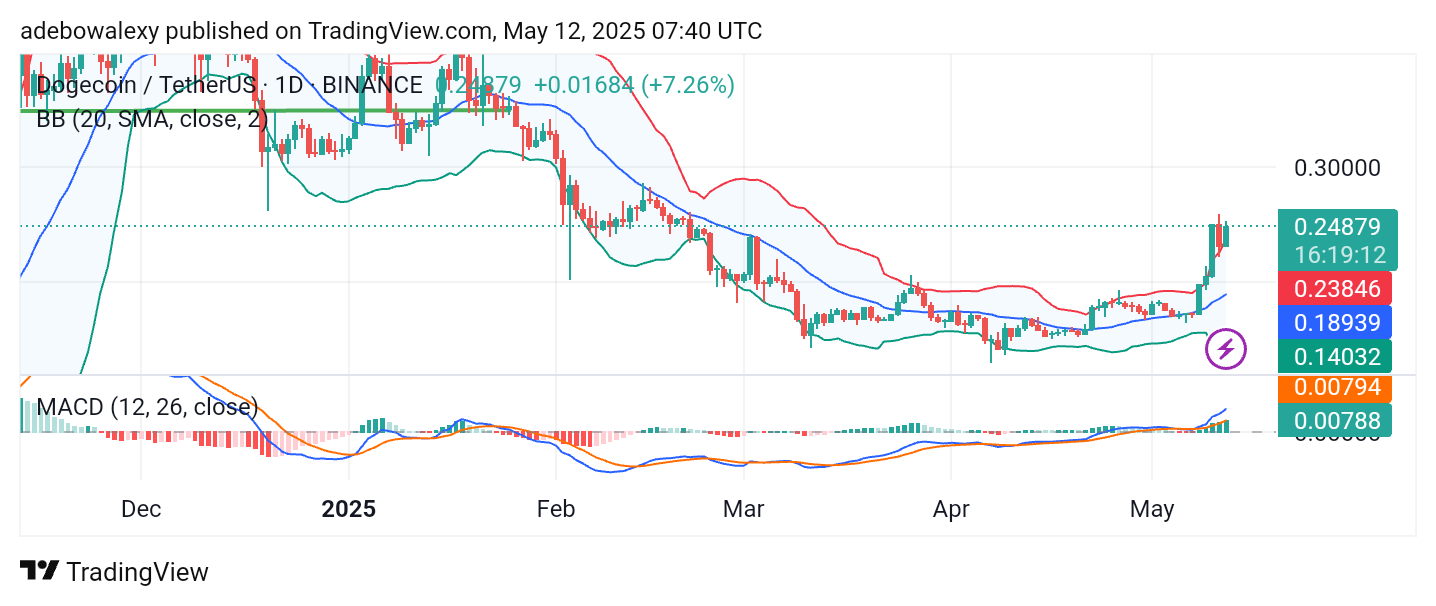
In the previous session, price action in the Dogecoin market retraced downward after breaching resistance at the upper limit of the Bollinger Bands. Nevertheless, trading activity remained outside the Bollinger Bands. The current session has sustained bullish momentum, keeping price action above the uppermost Bollinger Band. Meanwhile, the Moving Average Convergence Divergence (MACD) lines continue to trend above the equilibrium level, and the histogram bars remain solid green above the MACD’s baseline, signaling strong bullish momentum.
Dogecoin (DOGE) Price Prediction: DOGE/USDT Eyes the $0.3000 Price Level
Bullish momentum in the Dogecoin daily market appears to be building toward the psychological resistance level at $0.3000. The current session shows notable upward momentum, with the token trading above the upper Bollinger Band.
Similarly, the MACD indicator lines maintain an upward trajectory, and the histogram bars continue to show strength, confirming that bullish forces remain dominant. Therefore, it appears the market may continue to rise further.
Dogecoin (DOGE) Price Prediction: Buying Activity in the DOGE/USDT Remains Dominant
Shifting to the 4-hour chart, it is evident that bullish price activity has continued. Price candles have remained green for the past two sessions. Additionally, the Bollinger Bands are now tilted upward, indicating a strong upward trend. Technically, this suggests that the upside retracement is still in play.
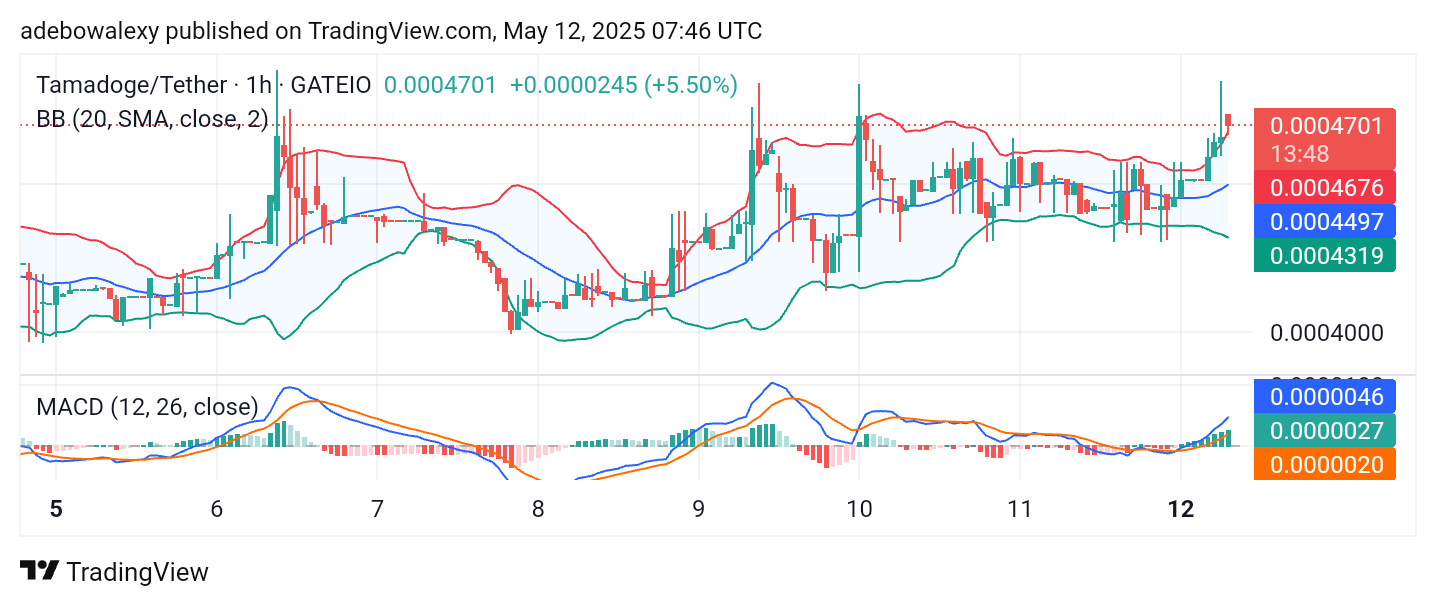
Similar to the daily chart, the MACD lines remain above the equilibrium level. Furthermore, the MACD indicator lines are now converging for another upward crossover. This suggests that the market is likely to breach the $0.2500 level soon and may advance toward the $0.3000 price level.
