UMA (UMAUSD) Retraces Into Deep Discount
Estimated Reading Time: 2 minutes
Don’t invest unless you’re prepared to lose all the money you invest. This is a high-risk investment and you are unlikely to be protected if something goes wrong. Take 2 minutes to learn more
UMA Market Analysis
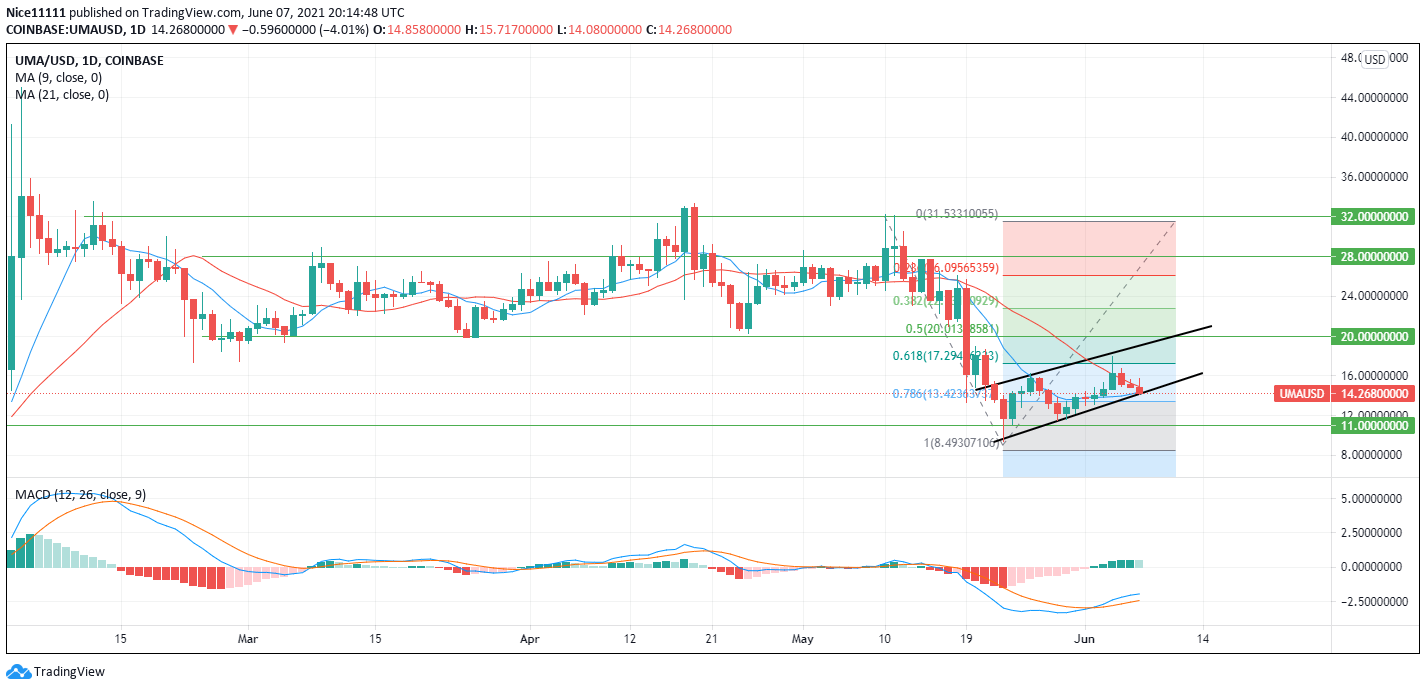
UMA experienced a bullish trend reversal upon reaching a support level at $11.00 on the 23rd of May this year. The coin was propelled with a sharp rejection upon reaching the support zone. UMA experienced its first major retracement after the trend reversal on the 27th of May. The retracement lasted for three days after which the rally continued. The previous low at the trend change was unaltered. The rally was stopped at the 0.618 Fibonacci level.
The market is currently experiencing its second major retracement which started on the fifth of this month. It is currently dipping into the 0.786 fib level. These present better opportunities to buy the coin at discount.
Significant Zones on UMA
Demand zones: $11.00, $20.00
Supply Zones: $28.00, $32.00
On the four-hour chart, the market reveals a steady rise within an ascending channel.

UMAUSD Market Prospects

The market has created higher highs and higher lows since price crashed into the $11.00 demand level. This signals bullishness in the market. The price on the market is currently headed for equilibrium at 0.5 in the Fibonacci level. This equilibrium rests on the higher demand zone at $20.00.
A breakout lower in the ascending channel would likely result in a plunge in price to retest the demand zone again at $11.00. The MACD (Moving Average Convergence Divergence) has confirmed bullishness in UMA with the cross seen below the zero mark on the daily chart.
The 21 Moving Average is currently above the last bearish candle’s body on the daily chart. The 9 Moving Average is just below the same candle body about to cross the 21 moving average signifying bullishness in the market.
Note: Cryptosignal.org is not a financial advisor. Do your research before investing your funds in any financial asset or presented product or event. We are not responsible for your investing results.