Polkadot (DOT) Rebounds Above $23.50, Uptrend Is Likely
Estimated Reading Time: 2 minutes
Don’t invest unless you’re prepared to lose all the money you invest. This is a high-risk investment and you are unlikely to be protected if something goes wrong. Take 2 minutes to learn more

Polkadot (DOT) Long-Term Analysis: Bearish
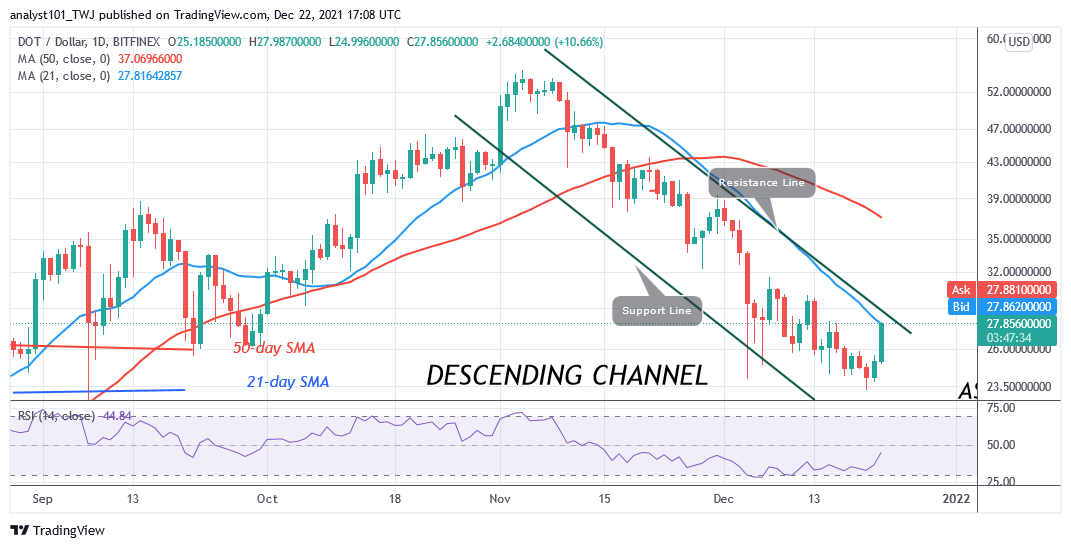
Polkadot’s (DOT) price has fallen to the low of $23.50 and rebounded indicating that an uptrend is likely. DOT price has reached the high of $27.72 at press time. The current bullish momentum is testing the 21-day SMA to break above it. The cryptocurrency will be out of downward correction if price breaks above 21-day and 50-day lines moving averages. On the other hand, if buyers fail to break above the moving averages, DOT/USD will fall and resume downward correction.
Polkadot (DOT) Indicator Analysis
Polkadot‘s price is breaking above the 21-day line moving average. If the altcoin is successful, it will resume an upward move and retest the 50-day line moving average. The recent upward move has pushed the altcoin to level 44 of the Relative Strength Index for period 14. The altcoin is still in the downtrend zone and below the centerline 50. DOT price is above the 40% range of the daily stochastic. The market has resumed bullish momentum.
Technical indicators:
Major Resistance Levels – $48, $52, $56
Major Support Levels – $32, $28, $24
What Is the Next Direction for Polkadot (DOT)?
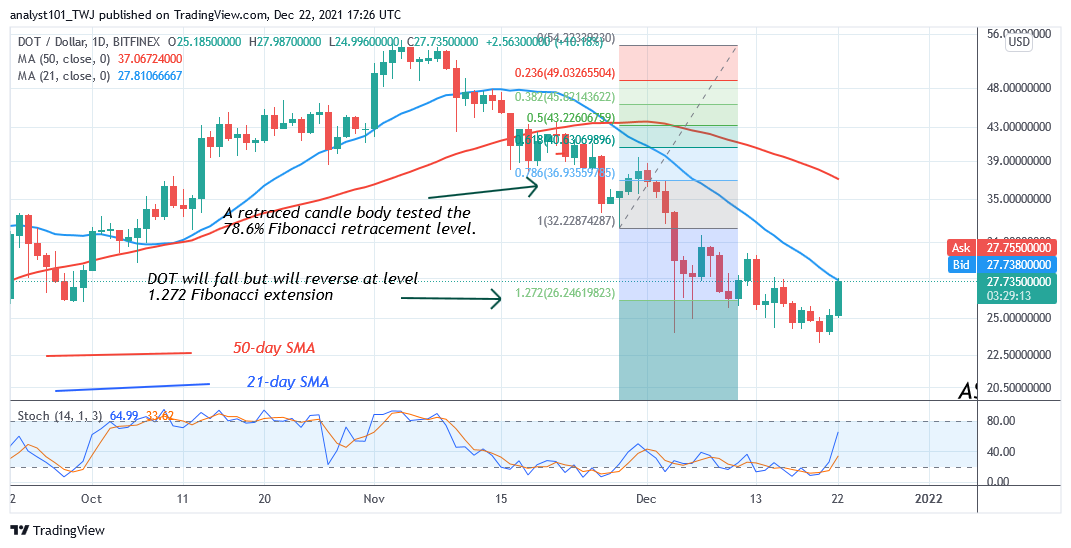
Polkadot is recovering from its downtrend. The downtrend has been terminated as the altcoin rebounds above the current support. The Fibonacci extension or $26.18 was broken as price extends to the low of $23.50. Today, the altcoin has resumed uptrend after a rebound.
You can purchase crypto coins here. Buy Tokens
Note: Cryptosignals.org is not a financial advisor. Do your research before investing your funds in any financial asset or presented product or event. We are not responsible for your investing results