Polkadot (DOT) Hovers above $26 as Buyers Emerge in the Oversold Region
Estimated Reading Time: 2 minutes
Don’t invest unless you’re prepared to lose all the money you invest. This is a high-risk investment and you are unlikely to be protected if something goes wrong. Take 2 minutes to learn more

Polkadot (DOT) Long-Term Analysis: Bearish
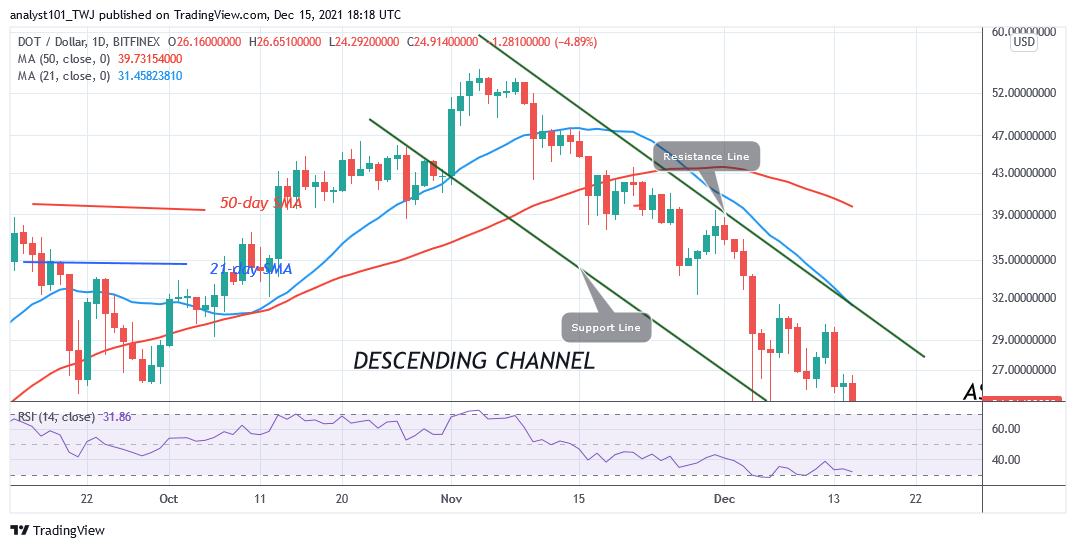
Polkadot’s (DOT) price is still in a downward correction at the bottom of the chart. After the December 4 price breakdown, DOT price plunged to $23.95 as bulls bought the dips. The crypto’s price corrected upward to $29.87 and resumed a range-bound movement. DOT/USD is now fluctuating between $24 and $30 price levels. The cryptocurrency has fallen to the oversold region of the market. A further downward move is unlikely. However, if the bears break the current support, the altcoin will further decline to $22.
Polkadot (DOT) Indicator Analysis
The altcoin is at level 32 of the Relative Strength Index for period 14. It indicates that the altcoin is approaching the oversold region of the market. DOT price is below the 20% range of the daily stochastic. The implication is that the selling pressure has reached bearish exhaustion. Buyers are likely to emerge in the oversold region of the market.
Technical indicators:
Major Resistance Levels – $48, $52, $56
Major Support Levels – $32, $28, $24
What Is the Next Direction for Polkadot (DOT)?
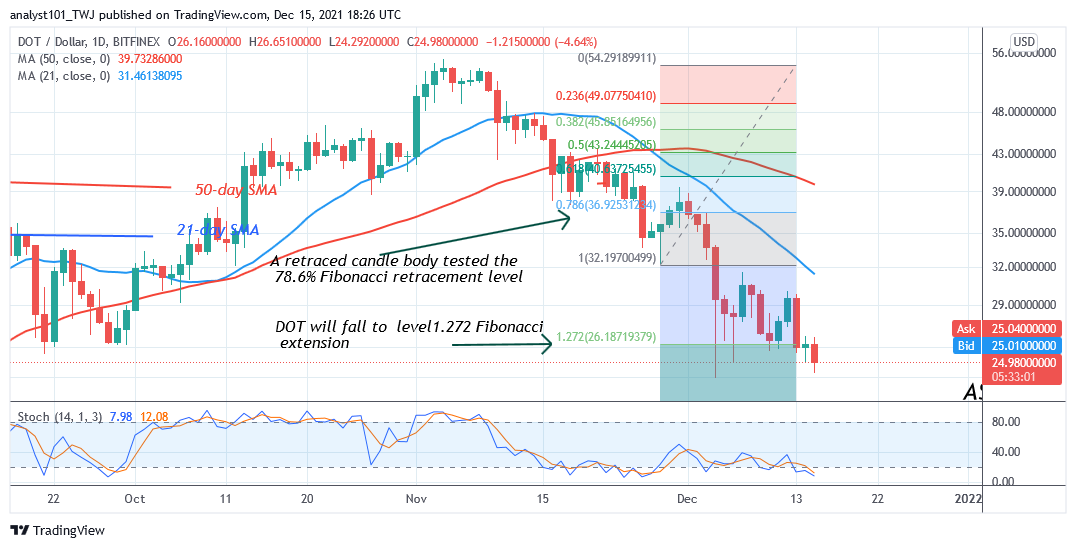
Polkadot is in a downtrend. The altcoin is fluctuating at the bottom of the chart. Meanwhile, on November 28 downtrend; a retraced candle body tested the 78.6% Fibonacci retracement level. The retracement indicates that DOT will fall but reverse at level 1.272 Fibonacci extension or $26.18. From the price action, DOT price is retesting the Fibonacci levels.
You can purchase crypto coins here. Buy Tokens
Note: Cryptosignals.org is not a financial advisor. Do your research before investing your funds in any financial asset or presented product or event. We are not responsible for your investing results