Polkadot (DOT) Holds Above $38.00 Support Amidst Bullish Expectation
Estimated Reading Time: 2 minutes
Don’t invest unless you’re prepared to lose all the money you invest. This is a high-risk investment and you are unlikely to be protected if something goes wrong. Take 2 minutes to learn more
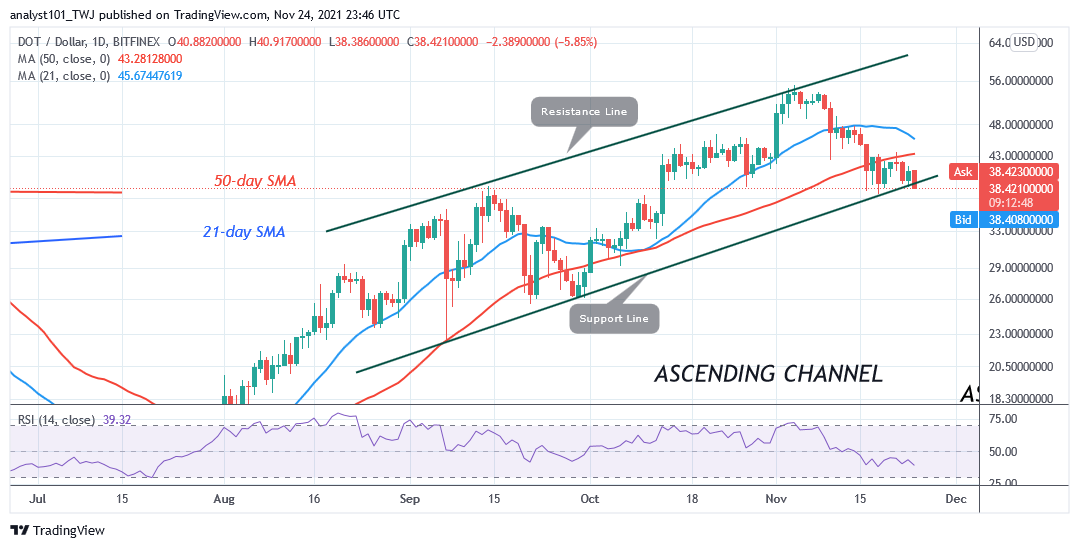

Polkadot (DOT) Long-Term Analysis: Bearish
Since November 16, Polkadot’s (DOT) price fell to the low of $38 as bulls bought the dips. DOT price corrected upward but was restricted at $43.50. For the past week, the price movement has been resisted between and $38 and $43.50 price levels. The $38 support is characterized by candlesticks with long tails. The long tail describes that the $38 support is a strong buying pressure. If the current support holds, buyers will push DOT price above the moving averages. They will attempt to revisit the previous high of $55.
Polkadot (DOT) Indicator Analysis
DOT price bars are still below the 21-day line and the 50-day line moving averages. The cryptocurrency is still in a downward correction. Polkadot is at level 39 of the Relative Strength Index for period 14. It is in the downtrend zone and capable of a further downward move. DOT /USD has fallen to the oversold region of the market. It is above the 30% range of the daily stochastic.
Technical indicators:
Major Resistance Levels – $48, $52, $56
Major Support Levels – $32, $28, $24
What Is the Next Direction for Polkadot (DOT)?
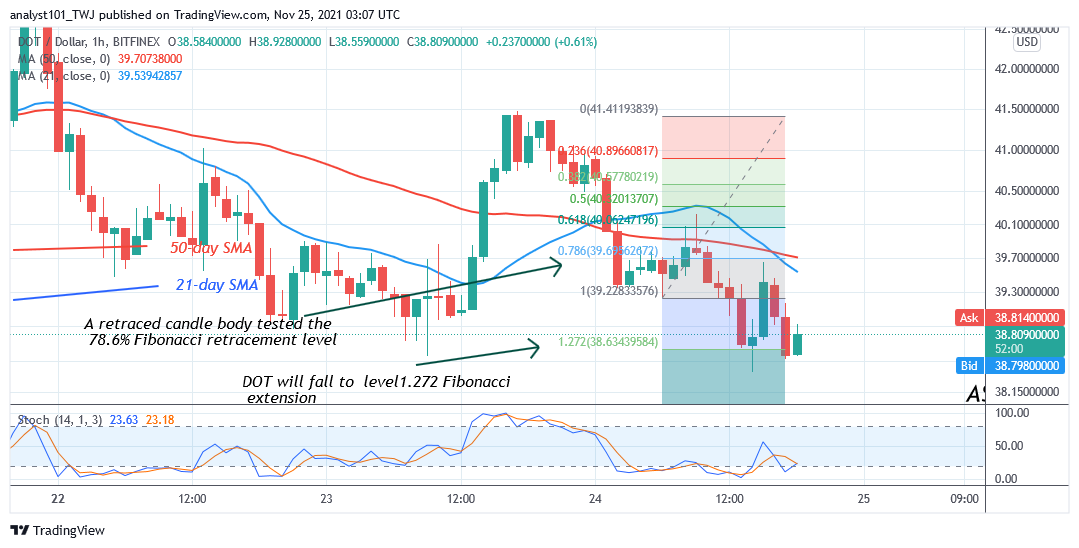
On the 4 –hour chart, Polkadot is consolidating above the $38 for a possible upward move. Meanwhile, on November 24 downtrend; a retraced candle body tested the 78.6% Fibonacci retracement level. The retracement indicates that DOT will fall to level 1.272 Fibonacci extension or $38.63.
You can purchase crypto coins here. Buy Tokens
Note: Cryptosignals.org is not a financial advisor. Do your research before investing your funds in any financial asset or presented product or event. We are not responsible for your investing results