Polkadot (DOT) In a Minor Retracement, Resumes Upward
Estimated Reading Time: 2 minutes
Don’t invest unless you’re prepared to lose all the money you invest. This is a high-risk investment and you are unlikely to be protected if something goes wrong. Take 2 minutes to learn more

Polkadot (DOT) Long-Term Analysis: Bullish
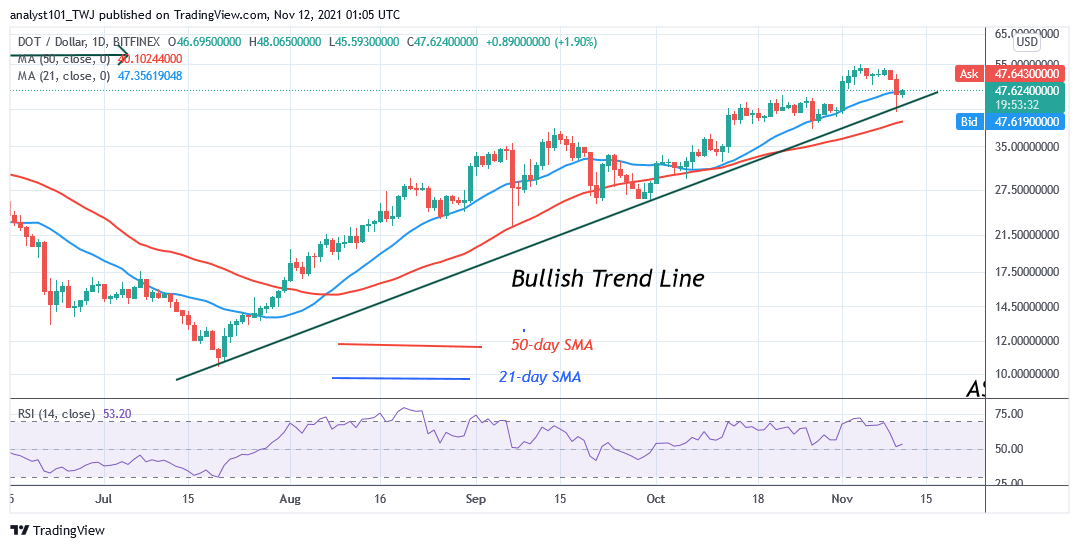
Polkadot’s (DOT) price has continued its upward move as it reaches the high of $55. Buyers retested the $56 resistance zone twice but could not sustain the bullish momentum above it. The cryptocurrency dropped to $42 low and resumed upward. Today, buyers have an uphill task to breach the $48 and $55 resistance levels. The $48 resistance level is the historical price level of May 2021. In the previous price level, the bulls could not breach the $48 high. Today, the DOT price is trading at $47.61 at the time of writing.
Polkadot (DOT) Indicator Analysis
DOT price has fallen to level 53 of the Relative Strength Index for period 14. It is in the uptrend zone and above the centerline 50. The crypto is resuming upward to revisit the previous high.
The price bars are above the moving averages indicating a possible rise of the coin. DOT price is above the 40% range of the daily stochastic. The market is in a bullish momentum .
Technical indicators:
Major Resistance Levels – $48, $52, $56
Major Support Levels – $32, $28, $24
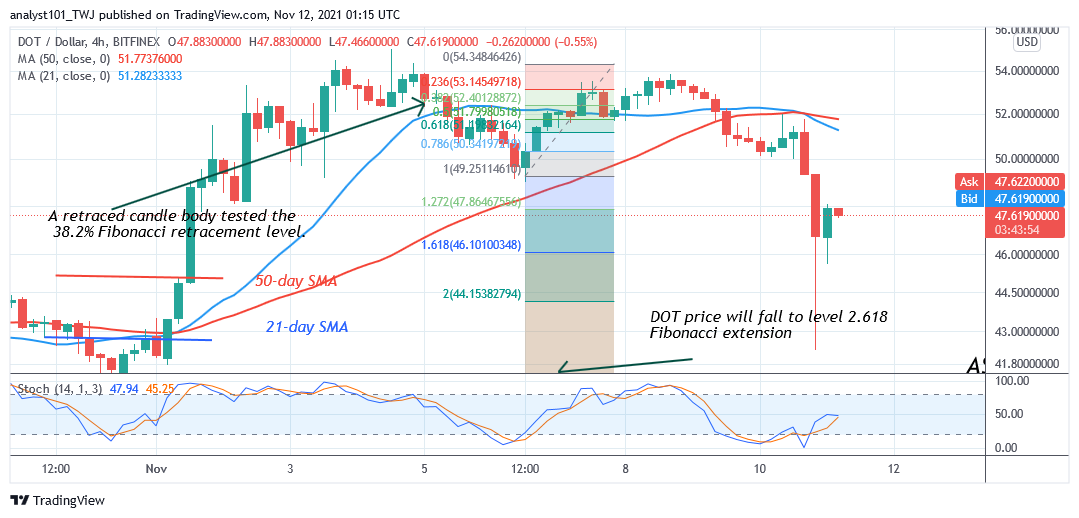
What Is the Next Direction for Polkadot (DOT)?
On the 4 –hour chart, the previous downtrend has subsided as bulls bought the dips. DOT/USD dropped to $42 low and pulled back. The long tail indicates that there is a strong buying pressure above the $42 support. Meanwhile, on the November 6 downtrend, a retraced candle body tested the 38.2% Fibonacci retracement level. The retracement indicates that DOT will fall to level 2.618 Fibonacci extension or $41. From the price action, the market reached the low of $42 and pulled back.
You can purchase crypto coins here. Buy Tokens
Note: Cryptosignals.org is not a financial advisor. Do your research before investing your funds in any financial asset or presented product or event. We are not responsible for your investing results