SPONGE/USD ($SPONGE) Still Holds the Possibility for a Rebound
Estimated Reading Time: 3 minutes
Don’t invest unless you’re prepared to lose all the money you invest. This is a high-risk investment and you are unlikely to be protected if something goes wrong. Take 2 minutes to learn more
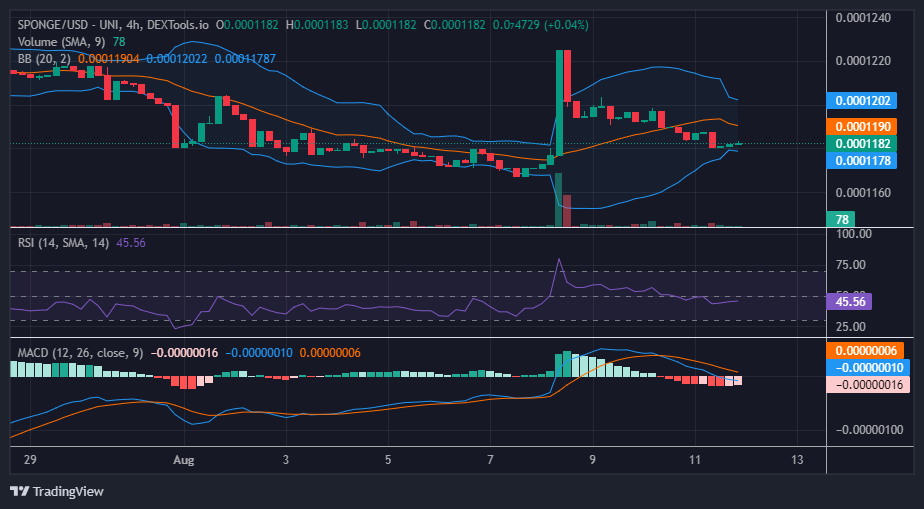
On August 8th, the $SPONGE market exhibited remarkable strength as it achieved an impressive high of $0.0001225. This surge was indicative of the substantial potential within the market. While this peak initiated a temporary bearish sentiment due to profit-taking activities, it’s important to note that such retracements are natural in any market cycle, allowing for healthy consolidation.
This retracement led the market to a crucial support level at $0.00012 on the very same day. The significance of this support level underscores the attention it commands within the trading community. The subsequent days witnessed a dynamic interplay between supply and demand, leading to a sideways price movement from August 8th to August 10th.
Key Levels
- Resistance: $0.0004, $0.0045, and $0.0005.
- Support: $0.00011, $0.00010, and $0.00009.
Sponge (SPONGE/USD) Price Analysis: The Indicators’ Point of View
Despite the tug-of-war between $SPONGE buyers and sellers during this period, it’s encouraging to observe the resilience displayed by the market. The bulls managed to effectively defend their position against the selling pressure, a testament to their underlying strength and determination.
Analyzing the Bollinger Bands indicator, a key technical tool, the sideways movement remains apparent. However, this can also be viewed as a consolidation phase, setting the stage for a potential breakout or sustained upward movement once market sentiment shifts. The fact that the lower standard deviation isn’t diverging downward suggests that the selling pressure might be easing, potentially indicating a transition towards a more balanced equilibrium.
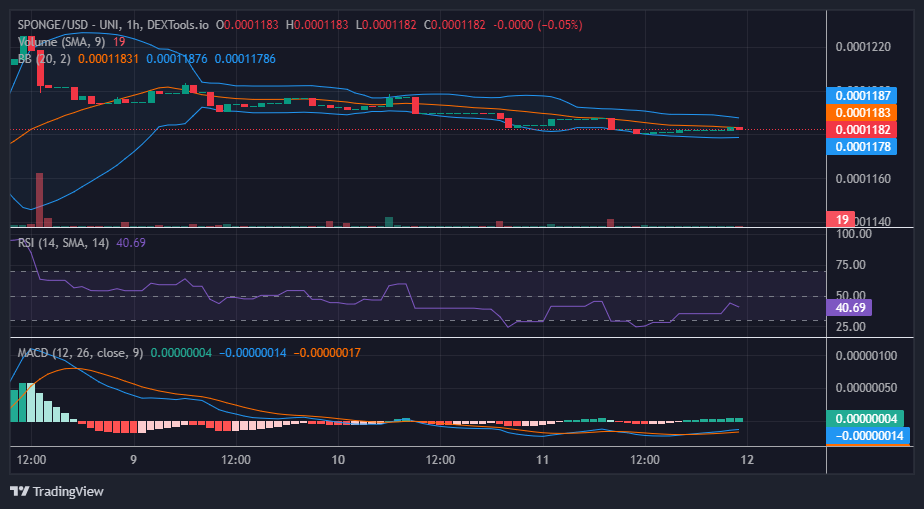
$SPONGE Short-Term Outlook: 1-Hour Chart
The current market situation for $SPONGE, while characterized by ranging behavior and retracement, provides ample reasons for optimism. The recent price achievements and the resilience of the bulls in the face of selling pressure highlight the underlying strength of the market. The ongoing consolidation and recalibration of price levels below the 20-day moving average set the stage for a potential bullish resurgence. As always, it’s important for traders and investors to exercise prudent risk management and remain attuned to further developments, as markets tend to surprise and present new opportunities when least expected.
Enter the LBank Exchange’s depths and start trading $SPONGE to wring out all the moisture!
🌊Hello #SPONGERS!👋🧽🌊
Plunge into the depths of #LBank_Exchange and kick off trading $SPONGE to soak up all the damp!🚀💰
🔗https://t.co/wJrs7ud3mD pic.twitter.com/OGEpd0sgCU
— $SPONGE (@spongeoneth) August 11, 2023
Invest in the hottest and best meme coin. Buy Sponge ($SPONGE) today!