SPONGE/USD ($SPONGE) Bulls Regroup at $0.0001189, Ready to Take the Market Above $0.00012
Don’t invest unless you’re prepared to lose all the money you invest. This is a high-risk investment and you are unlikely to be protected if something goes wrong. Take 2 minutes to learn more

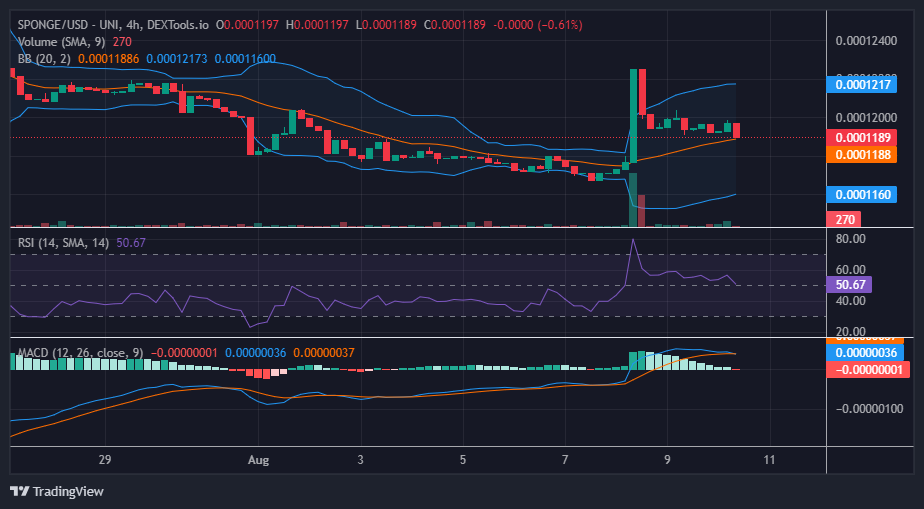
The recent bullish surge has established an elevated demand level for the SPONGE/USD market, precisely at $0.0001189. Initially, it was positioned at $0.00012; however, the bullish momentum faltered in the face of bearish pressure at this level. Consequently, the bulls were compelled to regroup just beneath the critical $0.00012 price threshold. In the current scenario, there’s a sense of anticipation for a more robust bullish advance.
Key Levels
- Resistance: $0.0004, $0.0045, and $0.0005.
- Support: $0.00011, $0.00010, and $0.00009.
Sponge (SPONGE/USD) Price Analysis: The Indicators’ Point of View
The Bollinger Bands indicator and the Relative Strength Index both depicted the SPONGE/USD market retracing towards the equilibrium level. This equilibrium point aligns with the emerging new demand level. Consequently, we expect a rebound around this level, notwithstanding the impression that bearish pressure has nudged the bullish market toward the brink of the sell zone.
Examining the Moving Average Convergence and Divergence (MACD) indicator, the market is currently situated in the bullish zone, positioned above the zero level. However, the histograms display a subdued green shade, accompanied by diminishing heights. Simultaneously, the two MACD lines have recently intersected.
$SPONGE Short-Term Outlook: 1-Hour Chart
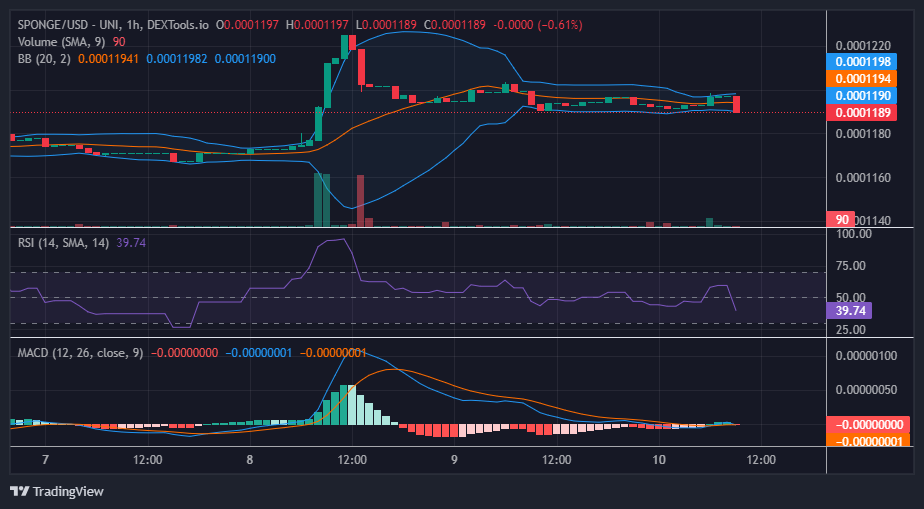
Although the most recent bearish candlestick from the 1-hour chart’s perspective implies a robust movement, the indicators appear to diverge from this market development. While the bearish candle seems to reflect dominant bearish sentiment during the last 1-hour trading session, the narrower standard deviation of the Bollinger Bands indicator contradicts this notion. Additionally, the volume of trade indicator lacks a corresponding histogram to validate this trend.
Consequently, there is a possibility that this bearish momentum is poised to diminish, potentially paving the way for bullish control to establish itself at this juncture.
The SPONGE/USD airdrop is still ongoing; don’t let this opportunity slip by.
🔔🌌 Don’t let the $SPONGE #Airdrop slip away! 🎁✨
🚀 Secure amazing goodies by registering today!
✔️ Finalise the verification steps on #Discord
📄 Navigate to the airdrop-registration corner
🔗 Complete the form and connect your profiles
👉 https://t.co/lzRhjW4WBj pic.twitter.com/YX2j4jOHA5
— $SPONGE (@spongeoneth) August 10, 2023
Invest in the hottest and best meme coin. Buy Sponge ($SPONGE) today!


