SPONGE/USD ($SPONGE) Reclaims the $0.00012 Price Level
Estimated Reading Time: 3 minutes
Don’t invest unless you’re prepared to lose all the money you invest. This is a high-risk investment and you are unlikely to be protected if something goes wrong. Take 2 minutes to learn more
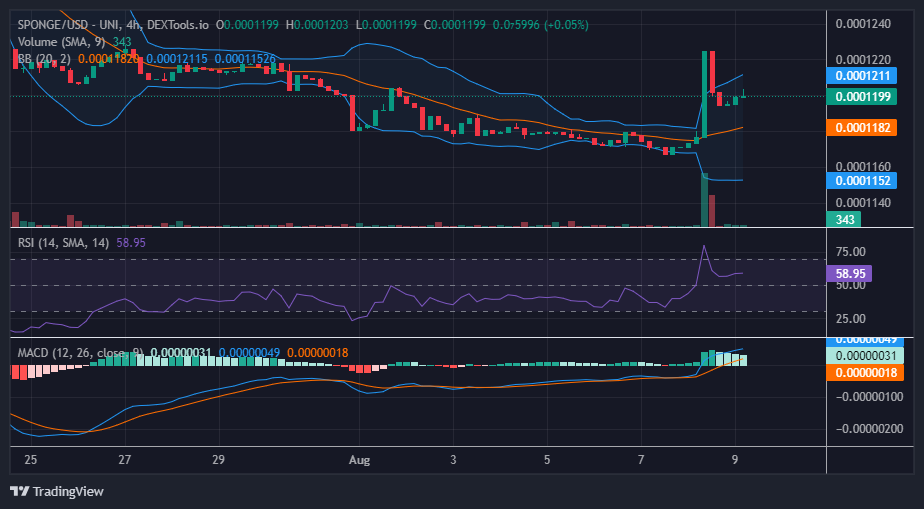
The SPONGE/USD ($SPONGE) market has recently experienced a noteworthy bullish breakthrough, liberating itself from the extended consolidation around the $0.000115 price mark. This breakout propelled the market significantly above the $0.00012 price level. However, a phase of profit-taking ensued, leading to a slight dip below the $0.00012 price level.
During this retracement, the bulls effectively secured support near the critical $0.00012 price level. This pivotal point acted as a foundation for the market’s subsequent resurgence, allowing it to recapture and hold onto the $0.00012 price level once again.
Key Levels
- Resistance: $0.0004, $0.0045, and $0.0005.
- Support: $0.00011, $0.00010, and $0.00009.
Sponge (SPONGE/USD) Price Analysis: The Indicators’ Point of View
The Relative Strength Index (RSI) provides insight into the $SPONGE market’s momentum. The robust bullish movement that facilitated the breakout from the previous stalemate was mirrored by a brief excursion of the market into overbought territory, as indicated by the RSI. This overbought phase was a result of the strong bullish sentiment, and it coincided with the initial stages of the price retracement.
As the price correction unfolded, the RSI line exhibited a retracement of its own, retracing back to a level of 55 on the RSI indicator. This retreat within the RSI reflects a moderation in the previously heightened buying pressure, aligning with the price’s corrective movement.
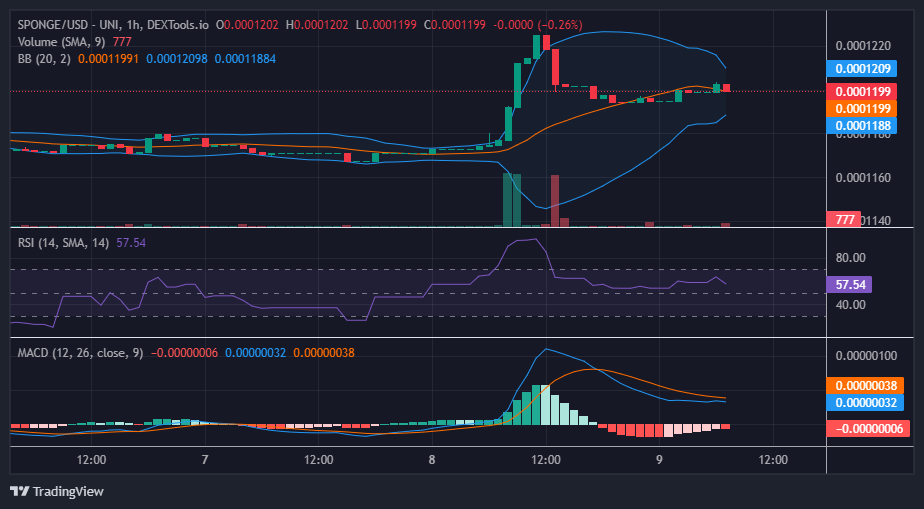
$SPONGE Short-Term Outlook: 1-Hour Chart
The SPONGE/USD ($SPONGE) market recently encountered a significant bullish breakout, effectively breaking free from the confines of the $0.000115 price level. While profit-taking led to a temporary dip below $0.00012, the bulls managed to find strong support at this level, allowing the price to reclaim and sustain the $0.00012 price point. Furthermore, the Bollinger Bands indicator is now showing signs of a volatility squeeze, and as demand matches supply at the crucial price level, another bullish price breakout may be imminent.
Buy the Sponge Token.
Look at it go…🚀 pic.twitter.com/XRNSF3DfRG
— $SPONGE (@spongeoneth) August 9, 2023
Invest in the hottest and best meme coin. Buy Sponge ($SPONGE) today!


