Upward Surge of SPONGE/USD ($SPONGE) as Market Searches for Elevated Support Beyond $0.00012
Estimated Reading Time: 3 minutes
Don’t invest unless you’re prepared to lose all the money you invest. This is a high-risk investment and you are unlikely to be protected if something goes wrong. Take 2 minutes to learn more
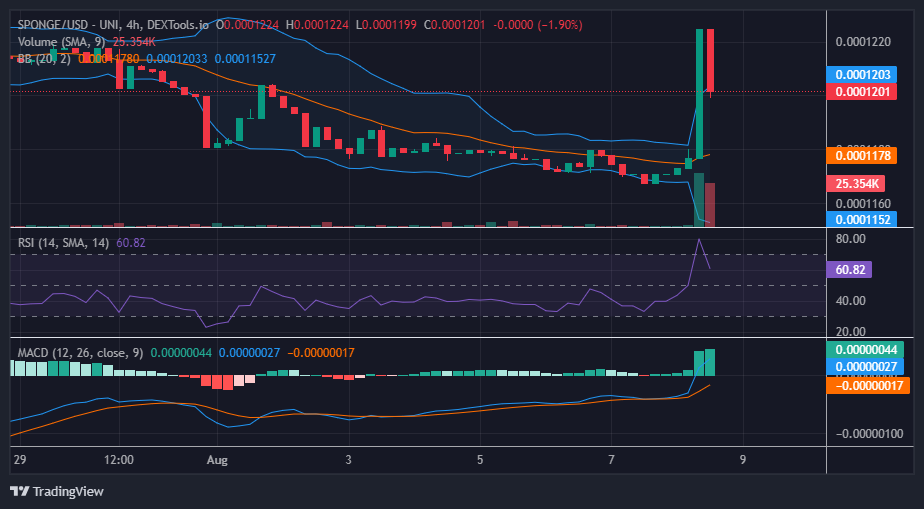
At long last, the SPONGE/USD pair is shattering the stalemate, propelled by robust support found near the $0.0001167 price threshold. The current daily trading session is distinctly marked by bullish activity, most notably during the third 4-hour trading session, during which a substantial bull market surge emerged, propelling the price towards the $0.00012 price range.
Key Levels
- Resistance: $0.0004, $0.0045, and $0.0005.
- Support: $0.00011, $0.00010, and $0.00009.
Sponge (SPONGE/USD) Price Analysis: The Indicators’ Point of View
The third SPONGE/USD trading session witnessed a pronounced bull market, visually characterized by a marubozu candlestick pattern. This pattern signifies complete dominance by the bulls, whose continuous buying prevailed throughout the entire trading session. Such a potent bullish trend naturally foreshadows an impending reversal or, more precisely, a price retracement. However, it remains imperative for buyers to safeguard the bullish price momentum by actively seeking a support level positioned at a higher price tier.
An evident candidate for a support level formation lies around the $0.00012 price mark. Already, observable market dynamics indicate a rebound around this juncture, reflecting resolute bullish interest. Furthermore, the Relative Strength Index (RSI) registers the market’s momentum at 60.82, suggesting room for further bullish movement.
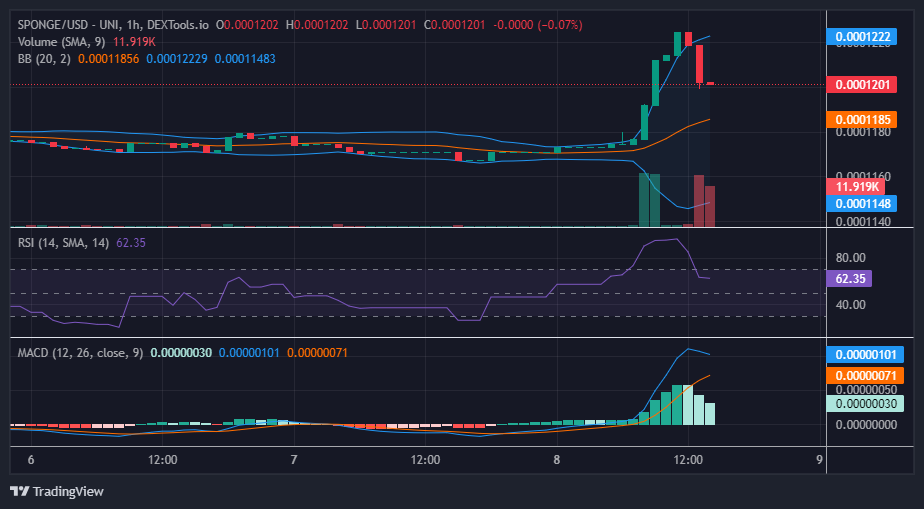
$SPONGE Short-Term Outlook: 1-Hour Chart
A pronounced price retracement originated from the $0.0001225 resistance level, exhibiting considerable strength. This phenomenon has induced a notable surge in volatility, as evident from the Bollinger Bands indicator. This heightened volatility could potentially yield a double-edged effect, offering opportunities for both the bullish and bearish markets to capitalize. Presently, however, the bullish sentiment is prevailing, with the upper hand being demonstrated by the bulls. Concurrently, a support level is taking shape at the $0.00012 price mark.
Discover the strength of this extraordinary MemeCoin that dominates the market!
🔥 Seize the chance to trade $SPONGE on @bitgetglobal! 🌪️📊💰
💫 Encounter the power of this exceptional #MemeCoin that stands above the competition! 🌟🚀💧
🔗 https://t.co/ZICW3aasuo pic.twitter.com/py2t1d6rC2
— $SPONGE (@spongeoneth) August 8, 2023
Invest in the hottest and best meme coin. Buy Sponge ($SPONGE) today!