SPONGE/USD ($SPONGE) Continues to Consolidate Around $0.0001175
Estimated Reading Time: 3 minutes
Don’t invest unless you’re prepared to lose all the money you invest. This is a high-risk investment and you are unlikely to be protected if something goes wrong. Take 2 minutes to learn more
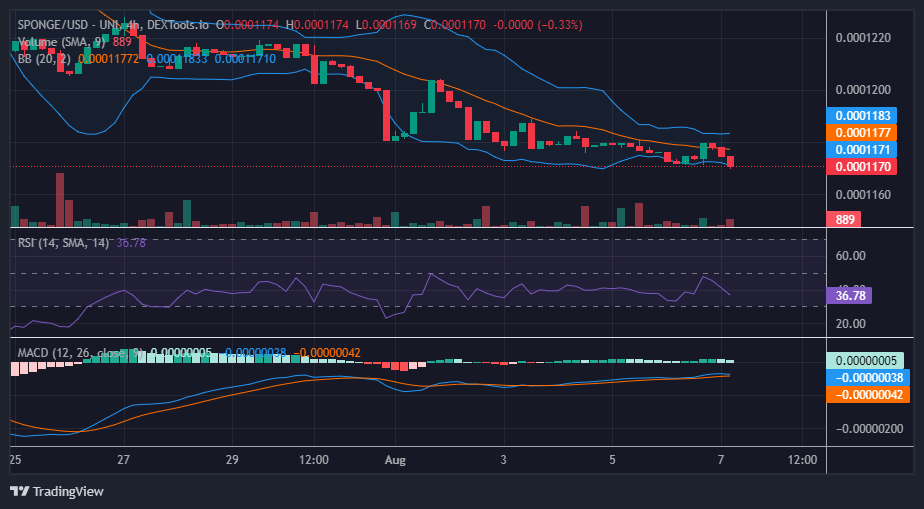
In the $SPONGE market, the price is currently exhibiting a period of consolidation, with the $0.0001175 price level acting as a significant point of interest. Bullish investors are making notable efforts to reverse the market’s direction from this level. However, it’s important to note that bearish pressure has caused a slight dip below the key demand level.
Despite this development, the bullish participants remain resilient and are still actively participating in the market, suggesting that the situation is far from being completely dominated by bears.
Key Levels
- Resistance: $0.0004, $0.0045, and $0.0005.
- Support: $0.00011, $0.00010, and $0.00009.
Sponge (SPONGE/USD) Price Analysis: The Indicators’ Point of View
For quite a while now, the $SPONGE market has been displaying a bearish trend in the Relative Strength Index (RSI). The momentum of the market has consistently fluctuated between the oversold section and the bearish section of the indicator, with occasional and brief bursts into the buy zone.
Traders and investors may act swiftly to secure profits during these brief bullish movements, which can lead to a return to the bearish zone once selling pressure resumes. The extended period of a flat market could be a contributing factor to the challenge of sustaining a bullish trend, as some buyers might promptly take their profits after holding long positions for an extended period in the market.
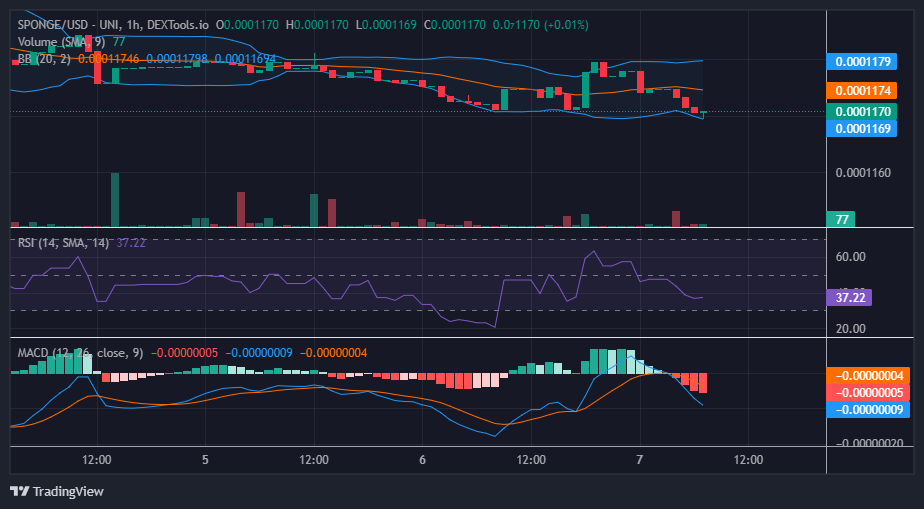
$SPONGE Short-Term Outlook: 1-Hour Chart
Furthermore, in terms of the 1-hour chart outlook, the market has maintained its eastward movement, although the price action has been oscillating around the 20-day moving average. The intermittent and brief bursts into the buy zone in the Relative Strength Index (RSI) could be attributed to short-term price corrections or temporary buying surges, where certain investors perceive potential value at specific price levels and capitalize on those opportunities. Nevertheless, these sporadic buy-side movements have not exhibited sufficient strength to sustain a lasting upward trend, resulting in the market returning to the bearish zone.
Don’t miss the SPONGE/USD airdrop.
👋Calling all #SPONGERS!🌊🗣️
💥Don’t miss out on the $SPONGE #Airdrop!🚀🎁
🌊Make sure you qualify on our #Discord to be eligible!✅
🧽Find all the airdrop-registration guidelines for complete clarity!📝💰
🔗https://t.co/lzRhjW4oLL pic.twitter.com/lfNgxekif2
— $SPONGE (@spongeoneth) August 7, 2023
Invest in the hottest and best meme coin. Buy Sponge ($SPONGE) today!


