SPONGE/USD ($SPONGE) Still Holds the Possibility For Bullish Performance
Estimated Reading Time: 2 minutes
Don’t invest unless you’re prepared to lose all the money you invest. This is a high-risk investment and you are unlikely to be protected if something goes wrong. Take 2 minutes to learn more
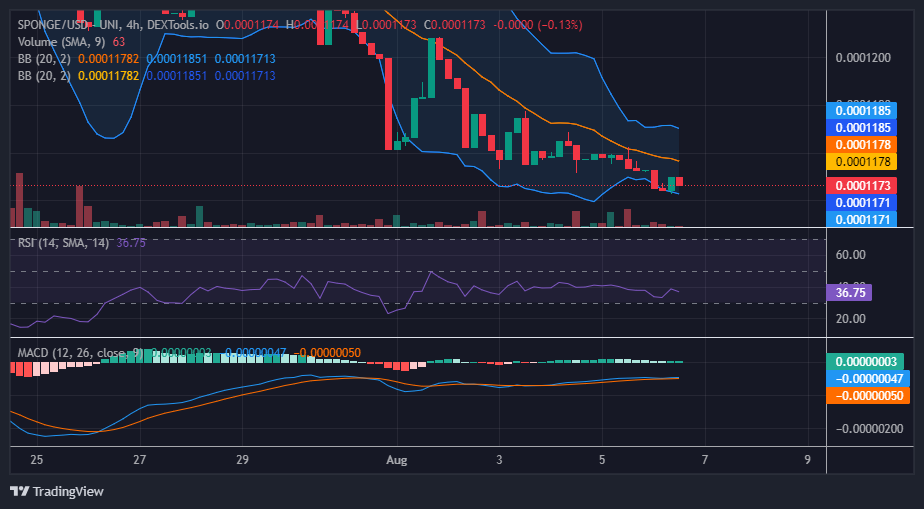
Despite the recent underperformance of the SPONGE/USD pair, there are indications that the market could be gearing up for a potential reversal. Analyzing the current price action and technical indicators, we identify several factors that may lead to a bullish scenario in the coming days.
Since the beginning of August, bulls have consistently kept the demand level at $0.0001177. This indicates strong buying interest at this price point, which could act as a significant support level for the pair.
Key Levels
- Resistance: $0.0004, $0.0045, and $0.0005.
- Support: $0.00011, $0.00010, and $0.00009.
Sponge (SPONGE/USD) Price Analysis: The Indicators’ Point of View
The recent appearance of a gravestone doji candlestick pattern is an encouraging sign for SPONGE/USD traders. This pattern, which reflects indecision in the market, is often seen as a potential reversal signal when it appears after a downtrend. It suggests that bears are losing strength, and a shift towards bullish activities could be on the horizon.
The RSI currently measures around 36.6, indicating that the market is not heavily oversold. While it is below the 50 threshold, the stability in the RSI suggests that selling pressure may be waning, providing a window of opportunity for bulls to regain control.
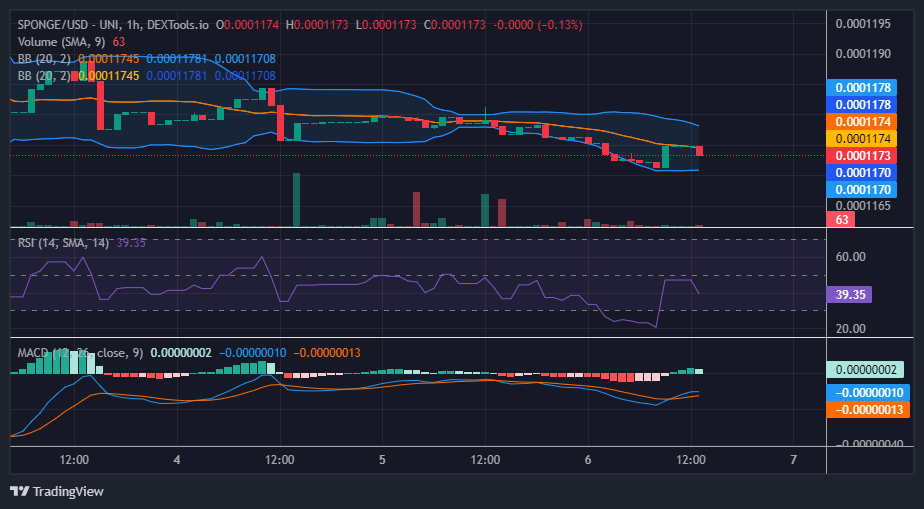
$SPONGE Short-Term Outlook: 1-Hour Chart
While the SPONGE/USD pair has been performing below expectations, the current technical analysis presents a mixed but cautiously optimistic outlook. The strong historical demand level, coupled with the appearance of the gravestone doji candlestick pattern and the bullish crossover of the MACD lines on this 1-hour timeframe, suggests the potential for a bullish trend to emerge in the near future.
Buy and sell this alluring MemeCoin now to join SPONGE in riding the wave.
💸 Excited to start trading $SPONGE on @MEXC_Global? 🎉
🚀 Buy and sell this captivating #MemeCoin and ride the wave with #SPONGE starting today! 🌊💪
💼 https://t.co/idowker7B5 pic.twitter.com/iQ2o69y2oG
— $SPONGE (@spongeoneth) August 5, 2023
Invest in the hottest and best meme coin. Buy Sponge ($SPONGE) today!