Fantom (FTM/USD): Impressive Bullish Momentum Propels Market Toward the $0.25 Price Threshold
Estimated Reading Time: 3 minutes
Don’t invest unless you’re prepared to lose all the money you invest. This is a high-risk investment and you are unlikely to be protected if something goes wrong. Take 2 minutes to learn more
In January, Fantom swiftly reached its yearly high at $0.66. Subsequently, over an extended period, the market has exhibited a continuous downward trend. Nevertheless, as the market approaches the $0.200 price threshold, there are indications that bullish sentiment may be attempting to reverse this trend.
Between mid-August and early September, the bearish market struggled to breach the $0.200 price mark. In response to relentless bearish pressure, the bulls managed to converge and establish support at $0.177, signaling a potential turning point in the market’s trajectory. This support level has become the epicenter of the emerging bullish trend. The bullish recovery easily breached the $0.200 price level and is currently surging towards the $0.2500 mark.
Fantom Market Data
- FTM/USD Price Now: $0.227
- FTM/USD Market Cap: $631,641,621
- FTM/USD Circulating Supply: 2,803,634,836 FTM
- FTM/USD Total Supply: 3,175,000,000 FTM
- FTM/USD CoinMarketCap Ranking: #58

Key Levels
- Resistance: $0.25, $0.27, and $0.30.
- Support: $0.15, $0.10, and $0.09.
Fantom Price Forecast: Examination of Vital Metrics
The divergence observed between the upper and lower standard deviations of the Bollinger Bands indicates a substantial bullish price movement within the Fantom market. This signifies an influx of traders entering the market to acquire positions as the price fell below the $2.00 level. Further reinforcing this sentiment, the trading volume indicator reveals a notable increase in trading activity. The rising histogram heights suggest robust participation from traders, resulting in a significant bullish trend. Given these compelling dynamics, one may reasonably anticipate that the market is poised to reach the $0.25 price level.
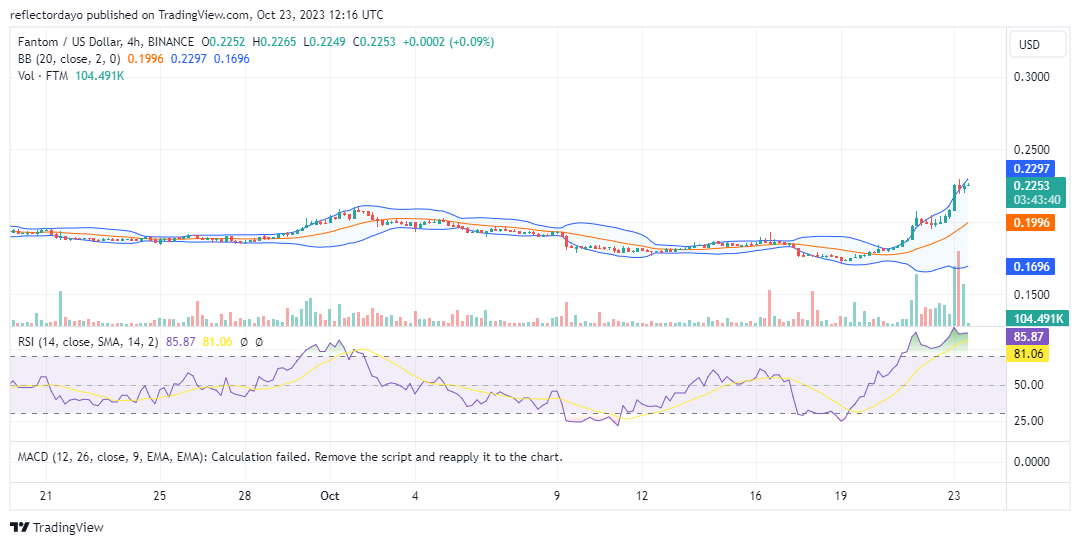
FTM/USD 4-Hour Chart Outlook
From a 4-hour chart perspective, the pronounced upward trajectory of the price is indeed noteworthy. It is essential to acknowledge that this bullish movement has also coincided with an increase in volatility, as indicated by the divergence of the Bollinger Bands. This suggests that bears might find opportunities in the heightened volatility; however, their influence appears relatively subdued at this time, as the prevailing market sentiment remains bullish. Nevertheless, the current brief price consolidation occurring around the $0.226 mark may potentially establish a new support level, further facilitating the continuity of the prevailing trend.