Solana (SOL/USD) on the Rise, Retracing the $32.00 Price Mark
Estimated Reading Time: 3 minutes
Don’t invest unless you’re prepared to lose all the money you invest. This is a high-risk investment and you are unlikely to be protected if something goes wrong. Take 2 minutes to learn more
Earlier this month, Solana experienced a price breakout from the $20.00 level, aiming towards $25.00. However, persistent bearish resistance around the $25.00 mark posed challenges for the bullish market throughout the majority of October. Following a retracement from the $25.00 level, the bulls orchestrated a market turnaround by establishing a support level at $21.15. Subsequently, they managed to secure a higher support level at $23.43, ultimately enabling the bullish trend to breach the $25.00 price barrier. Solana is currently in active pursuit of its mid-July peak, which stands at $32.00.
Solana Market Data
- SOL/USD Price Now: $26.48
- SOL/USD Market Cap: $875,587,646
- SOL/USD Circulating Supply: 416,599,167 SOL
- SOL/USD Total Supply: 560,381,486 SOL
- SOL/USD CoinMarketCap Ranking: #8
Key Levels
- Resistance: $28.00, $29.00, and $30.00.
- Support: $23.00, $22.00, and $21.00.
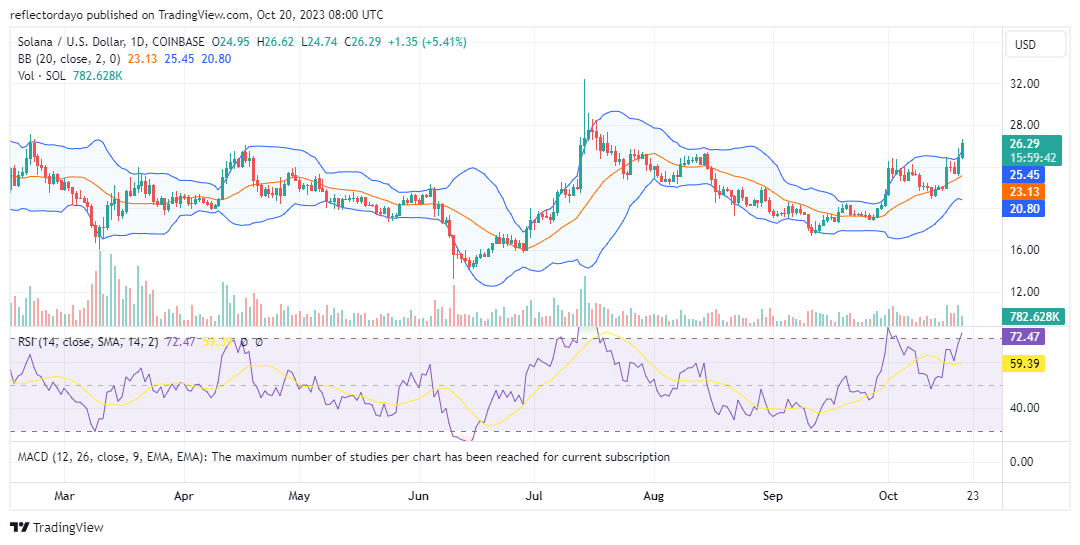
Solana Price Prediction: Analysis of Key Indicators
The Bollinger Bands indicator indicates an upward-trending market. While the Bollinger Bands are trending upward, the price action is surpassing these bands. This suggests that the intense bullish sentiment surrounding Solana may have pushed the market into an overbought condition. This notion is supported by the Relative Strength Index (RSI), which currently registers at 72.89. Solana holds the potential to reach the $32 price level, having successfully breached the long-term resistance at $25, which has likely prompted many traders to adopt a bullish bias. Nevertheless, an obstacle lies at the $28.00 price level, which must be overcome for further progress in the market.
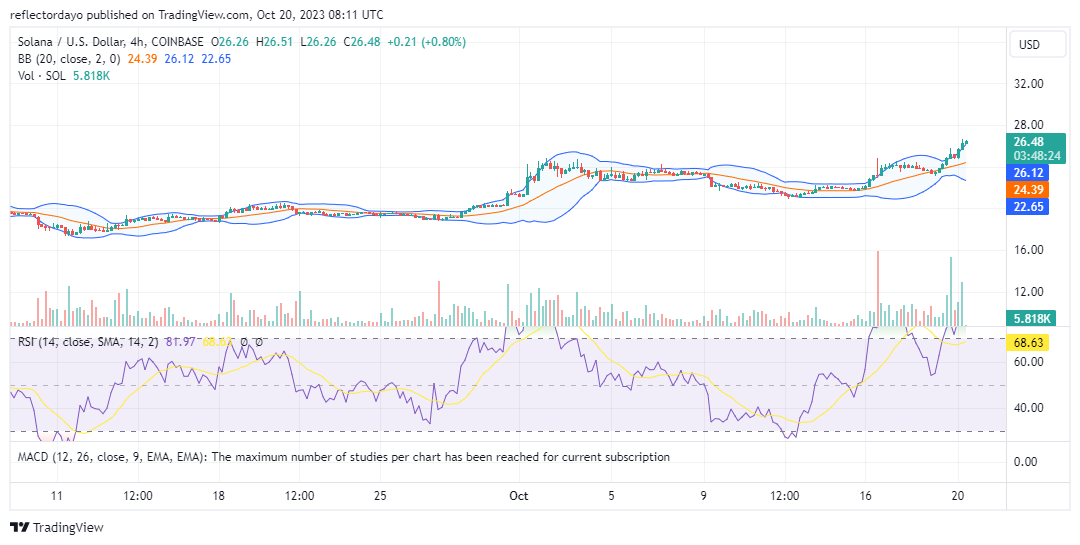
SOL/USD 4-Hour Chart Outlook
The Solana market in the 4-hour timeframe is displaying noteworthy momentum. The price action consistently trends upward in alignment with the upper band of the Bollinger Bands indicator. These market dynamics are concurrently driving the divergence of the Bollinger Bands, indicating robust momentum and notable buying pressure.
Nonetheless, it’s worth noting that the market could potentially encounter resistance around the $28.00 price level. Such resistance may act as a catalyst for the bullish market to establish a strong support level, thereby facilitating the continuity of the bullish trend.