UMA (UMAUSD) Reaches $7.500 for Underside Resistance
Estimated Reading Time: 3 minutes
Don’t invest unless you’re prepared to lose all the money you invest. This is a high-risk investment and you are unlikely to be protected if something goes wrong. Take 2 minutes to learn more
UMAUSD Analysis – UMA Crashes to Underside Resistance at $7.500
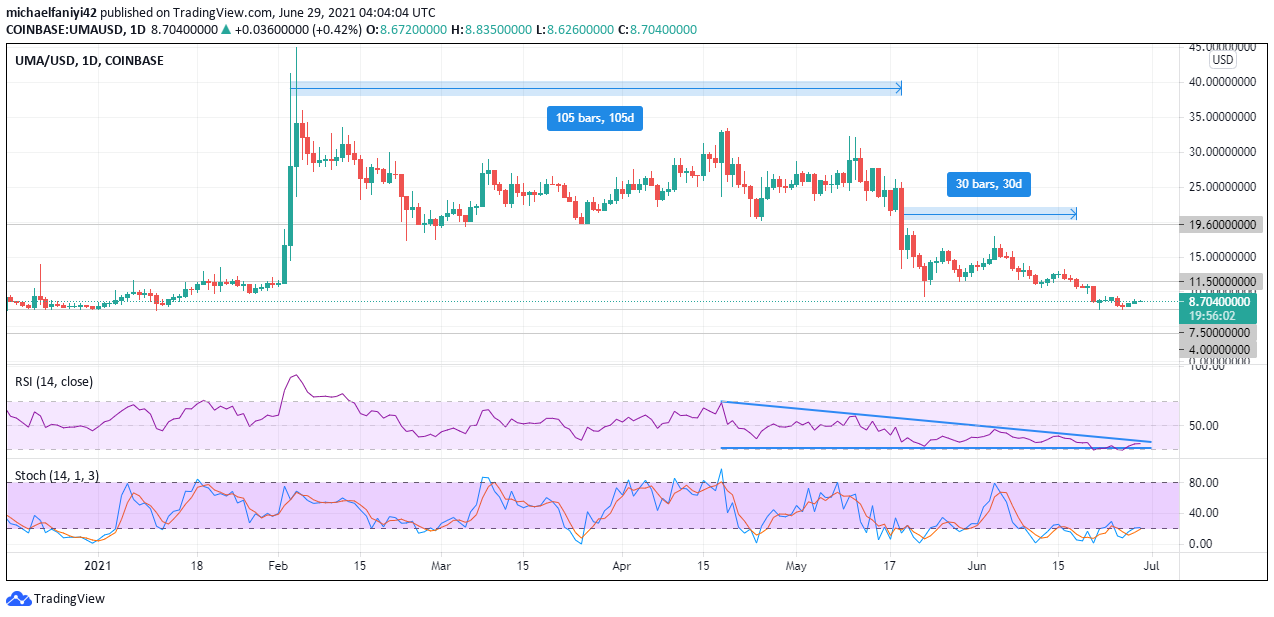
The UMA reaches $7.500 for underside resistance. The $7.500 key level is the penultimate key level at which UMA can trade before plunging to an all-time low. It was from this support that the coin gained strength to spring up on the 2nd of February 2021.
The market jumped from the $7.500 key level to the $45.000 key level, representing a 140% increase. Following that, the market encountered resistance and eventually fell to $19.600 support. The market traded above the support level for 105 trading days, making zigzag movements.
There was another major market move on the 19th of May 2021 in a bearish direction. The bears dragged UMA down from $19.600 support to $11.500 support. The $11.500 support also defended the price for 30 trading days, from May 19th to June 18th, 2021. The market has now fallen further to return to the $7.500 support where it all started from.
The key levels have been very influential in determining the market’s movement. The $7.500, $11.500 and the $19.600 key levels have played a major role in the market’s movement throughout the year. They have had to switch from resistance to support to direct the market.
The RSI (Relative Strength Index) indicator shows that there has been a steady decline in prices from the 18th of April 2021. Its signal line had fallen from the 70 mark (just before the overbought region) to just above the 30 mark (just above the oversold region). Its current position of 35 shows that there is enough space for bullish movement, but the bears could yet drag the market to its all-time low at $4.000. The Stochastic oscillator also has its signal line resting on the line just before the oversold region, moving up from a bearish position. This signifies some bullish market movements.
UMAUSD Key Levels
Resistance: $19.600, $11.500
Support: $7.500, $4.000

Market Expectations

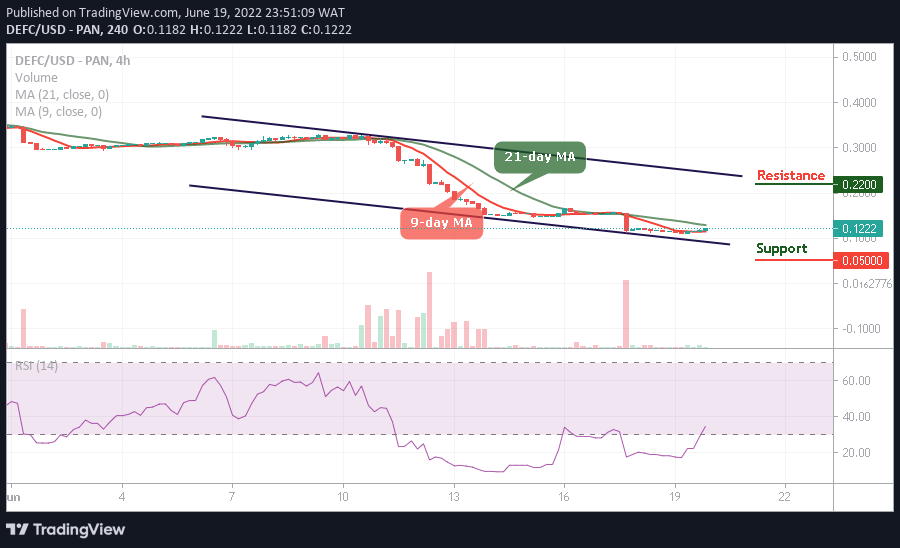
On the four-hour chart, UMAUSD has bounced off the $7.500 support twice and is currently moving upwards. The RSI confirms upwards momentum as its signal line is currently at 56.27 and faces upwards. The Stochastic oscillator, meanwhile, is already in the overbought region and indicates a little more bullish movement before there is a decline in the price.
You can purchase crypto coins here. Buy Tokens
Note: Cryptosignal.org is not a financial advisor. Do your research before investing your funds in any financial asset or presented product or event. We are not responsible for your investing results.