DeFi Coin Price Prediction: DEFC/USD Range-bounds As Price Targets $0.15 Level
Estimated Reading Time: 2 minutes
Don’t invest unless you’re prepared to lose all the money you invest. This is a high-risk investment and you are unlikely to be protected if something goes wrong. Take 2 minutes to learn more

Free Crypto Signals Channel
The DeFi Coin price prediction reveals that if bulls increase their momentum, the DEFC would hit a higher level as the coin faces the upside.
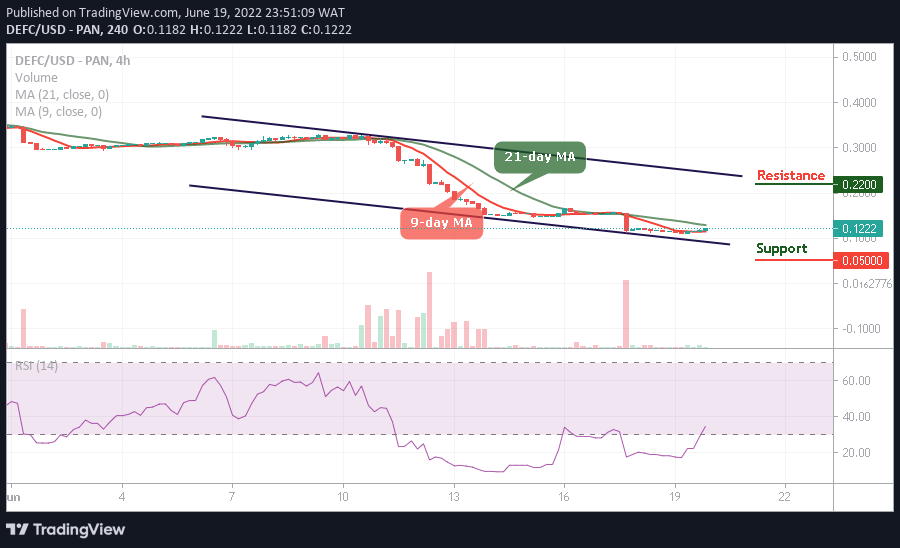
DEFC/USD Medium-term Trend: Ranging (4H Chart)
Key Levels:
Resistance levels: $0.22, $0.24, $0.26
Support levels: $0.05, $0.03, $0.01
DEFC/USD is moving sideways as the coin crosses above the 9-day moving average. Meanwhile, the bullish momentum is getting ready for a cross above the nearest resistance level of $0.0.15.
DeFi Coin Price Prediction: DEFC/USD Would Spike to the Upside
The DeFi Coin price is changing hands at the resistance level of $0.12, where it will continue to face the upside. However, if the coin crosses above the 21-day moving average, it may locate the potential resistance levels at $0.22, $0.24, and $0.26. In addition, any bearish movement could lead to the support levels of $0.05, $0.03, and $0.01 for the new entries, while the technical indicator Relative Strength Index (14) recovers from the oversold region.
DEFC/USD Medium-term Trend: Ranging (2H Chart)
The DeFi Coin price moves to cross above the upper boundary of the channel as the technical indicator Relative Strength Index (14) moves above the 50-level. However, any further bullish movement above the channel will touch the resistance level at $0.18 and above.
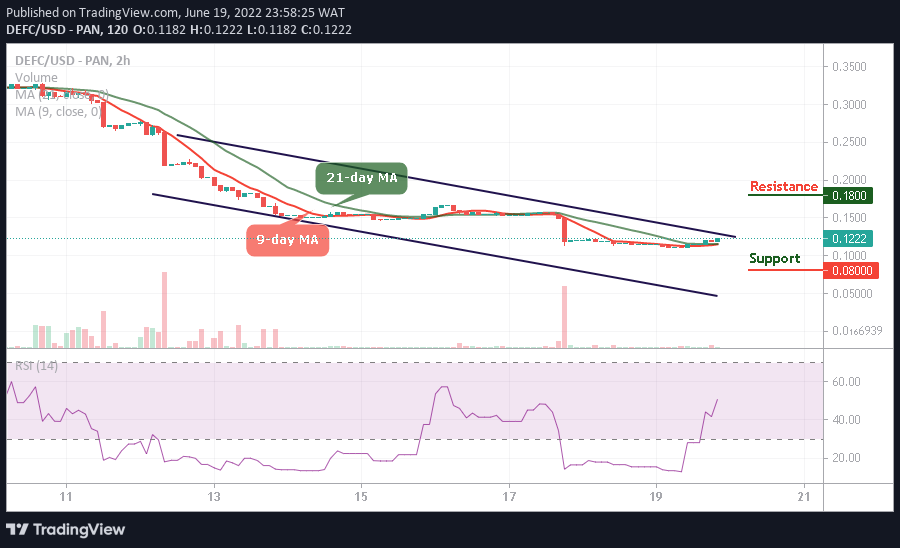
Moreover, DEFC/USD would display some bullish signals as revealed in the chart, once this happens, the market price will head to the upside, but if the price drops and move towards the lower boundary of the channel, it could hit the nearest support at $0.08 and below.
You can purchase DeFi Coin here. Buy DEFC