Polkadot (DOT/USDT) Attempting a Base Formation as Sellers Lost Momentum Near Multi-Month Lows
Estimated Reading Time: 3 minutes
Don’t invest unless you’re prepared to lose all the money you invest. This is a high-risk investment and you are unlikely to be protected if something goes wrong. Take 2 minutes to learn more
The market for Polkadot against Tether has seen a 9.51% increase in the previous 24 hours. This rise indicates that the pair is performing better than the crypto market’s 3.86% gains, as the pair’s monthly trend shows a 14% gain. However, despite the recent positive move, the pair seems to be recovering from a recent decline. Meanwhile, current actions show renewed interest as altcoin investors become more willing to invest.
As it stands, analysts are of the opinion that the spot trading for Polkadot on the Robinhood platform is the major reason for the upward drive, as everyday trading becomes easier for investors.
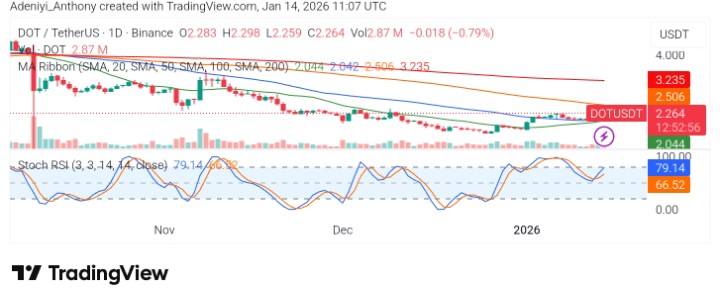
Currently, Polkadot trades at $2.264 with more than 2.87 million traded volumes today.
Technical Indicators
Major Resistance Levels: $2.500, $3.230, and $4.000
Major Support Levels: $2.190, $2.040, and $1.950
Technical Analysis
After what seems to be printing of lower highs and prolonged downside, Polkadot against Tether on the daily timeframe has been observed to be showing weakened bearish momentum as the price appears to be stabilizing above the $2.190 support level. As it stands, the volume indicator suggests aggressive distribution has eased with the short-term moving averages converging.
From another angle, the Stochastic RSI was reported to be recovering from mid-range levels, though this shows bullish intent, but trend reversal has not been confirmed. To this end, a sustained daily close above $2.50 would be required to invalidate the broader bearish bias and signal a potential trend transition toward the $3.20 resistance zone. Meanwhile, until that occurs, the pair might remain in a consolidation-within-downtrend phase.
Polkadot’s Update
The Polkadot chart is obviously not bullish, but the price appears to have reacted to another Fibonacci support level. This marks a favie-wave move up as the price heads towards a structural resistance around $2.39. However, the token has failed to hold above critical higher lows in the past; the current move may act similarly. To this end, a bullish trend on the short term will unfold only if the coming pullback is a corrective one.
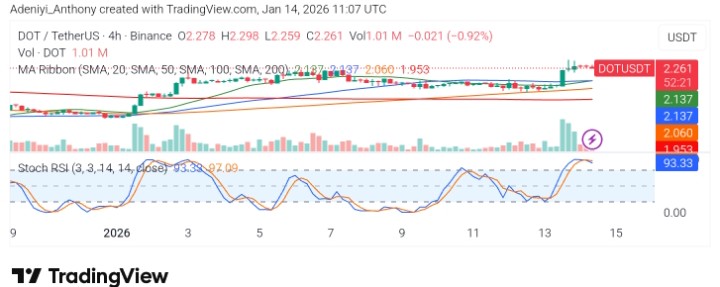
DOT/USDT Analysis: Overbought, What’s Next?
On the 4-hour timeframe, DOT/USDT appears to be consolidating after a break above the cluster of the moving average ribbons. This seems to be complementing the daily consolidation narrative. However, the price action was observed to be controlled by the bears momentarily as candles turned red.
On the other hand, the Stochastic RSI on the 4h chart seems to be operating in the overbought region with bent lines, suggesting a potential pullback might be on the way. To this end, if the $2.040 line is not maintained, current gains may be erased.
You can purchase crypto coins here. Buy Crypto