BNB Stabilizes above $600 amid Market Volatility
Estimated Reading Time: 3 minutes
Don’t invest unless you’re prepared to lose all the money you invest. This is a high-risk investment and you are unlikely to be protected if something goes wrong. Take 2 minutes to learn more

BNB (BNB) Long-Term Analysis: Ranging
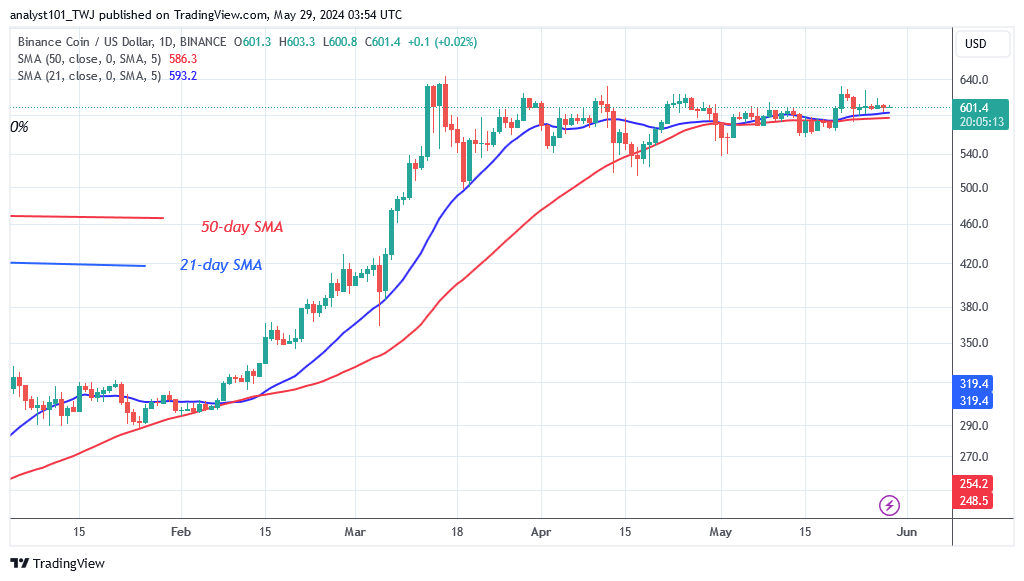
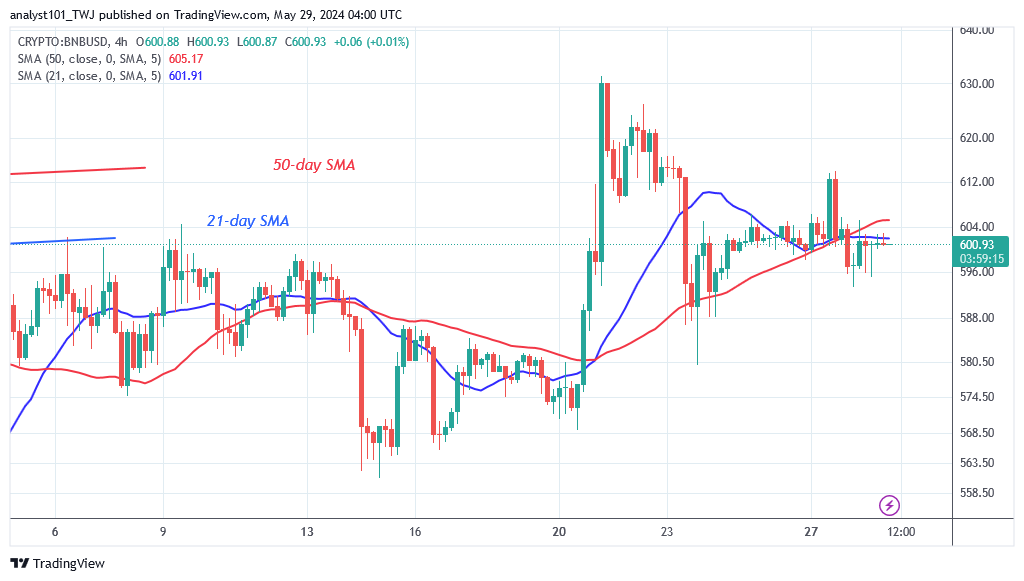
The BNB price has stabilized above the moving average lines amid market volatility. The bulls have an advantage over the bears because the altcoin is above the moving average lines. On May 25, there was a price spike as the altcoin fell rapidly after hitting the $624 resistance level. The bulls failed to sustain the price above the $635 overhead resistance. The bulls are defending the 21-day SMA as the cryptocurrency price consolidates above it.
The small body and uncertain candlesticks limit the cryptocurrency’s price movement. Since the creation of the Doji candlesticks, the price has held stable above the $580 support. The coin’s upward and downward movement seems doubtful. BNB/USD is now worth $602 at the time of writing.
Technical indicators:
Major Resistance Levels – $600, $660, $720
Major Support Levels – $400, $340, $280
BNB (BNB) Indicator Analysis
BNB has resumed its horizontal trend, with price bars consolidating above the moving average lines. The creation of Doji candlesticks has prevented the crypto asset from rising. For the past week, traders have been unable to choose as the altcoin has consolidated above the moving average lines.
What Is the Next Direction for BNB (BNB)?
Binance Coin is currently consolidating above the moving average lines amid market volatility. Since May 20, price movements have been modest due to traders’ uncertainty regarding the market’s direction. The altcoin trades above the moving average lines, giving the bulls an advantage. BNB is trading above the $602 support.
A price rebound will push the altcoin above the $635 overhead resistance. The crypto signal is ranging as the altcoin continues to consolidate above the 21-day SMA.
You can purchase Lucky Block here. Buy LBLOCK
Note: Cryptosignals.org is not a financial advisor. Do your research before investing your funds in any financial asset or presented product or event. We are not responsible for your investing results