BNB Pulls Back into Its Range as It Faces Rejection at $630
Estimated Reading Time: 2 minutes
Don’t invest unless you’re prepared to lose all the money you invest. This is a high-risk investment and you are unlikely to be protected if something goes wrong. Take 2 minutes to learn more

BNB (BNB) Long-Term Analysis: Ranging
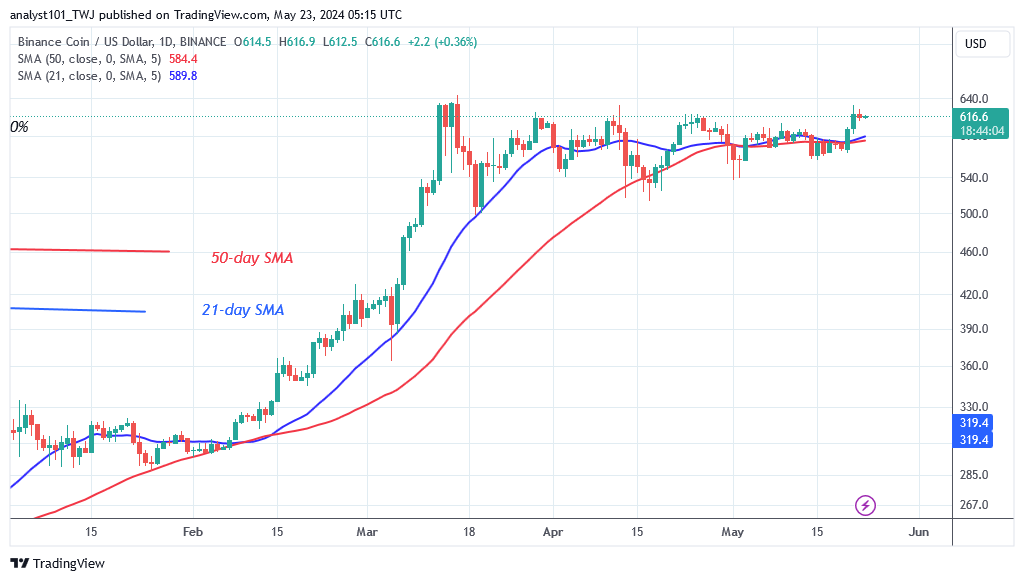
The BNB price breaks above the moving average lines to reach the resistance at $631 but faces rejection at $630. The Doji candlesticks are limiting the price upward movement. The altcoin has fallen into its range after hitting the high of $631. On the upside, if the bulls overcome the resistance at $635, BNB will rise to the next high of $693.
Today, BNB/USD has retraced to the low of $615.60. It is consolidating above the $600 support to resume the upward move. Nonetheless, a price rebound above the $600 support will catapult the altcoin to the targeted price level. The selling pressure will resume when the price breaks below the moving average lines.
Technical indicators:
Major Resistance Levels – $600, $660, $720
Major Support Levels – $400, $340, $280
BNB (BNB) Indicator Analysis
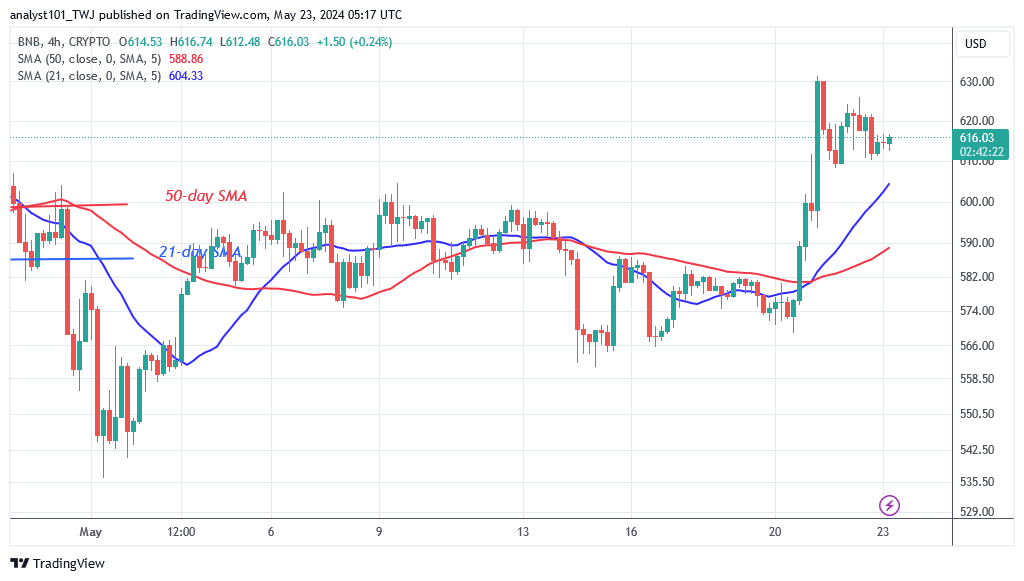
Following the May 20 price bounce, the price bars are now above the moving average lines. The resistance at $630 and the Doji candlesticks have slowed the cryptocurrency’s upward movement. The range-bound move is still on track as the horizontal moving average lines remain flat.
What Is the Next Direction for BNB (BNB)?
Binance Coin reaches a high of $631 but faces rejection at $630. The bullish momentum has failed to break above the $635 resistance level and has retreated into the range-bound zone. The altcoin is currently trading above its $600 support and the resistance at $630. On the downside, if the bears break below the $600 support, BNB will drop to a low of $590 or $562. The existence of Doji candlesticks raises doubts about the upward trend. The crypto signal is limited in its range as the altcoin retreats.
You can purchase Lucky Block here. Buy LBLOCK
Note: Cryptosignals.org is not a financial advisor. Do your research before investing your funds in any financial asset or presented product or event. We are not responsible for your investing
results