BNB Is Stable as It Consolidates above the $580 Support
Estimated Reading Time: 2 minutes
Don’t invest unless you’re prepared to lose all the money you invest. This is a high-risk investment and you are unlikely to be protected if something goes wrong. Take 2 minutes to learn more

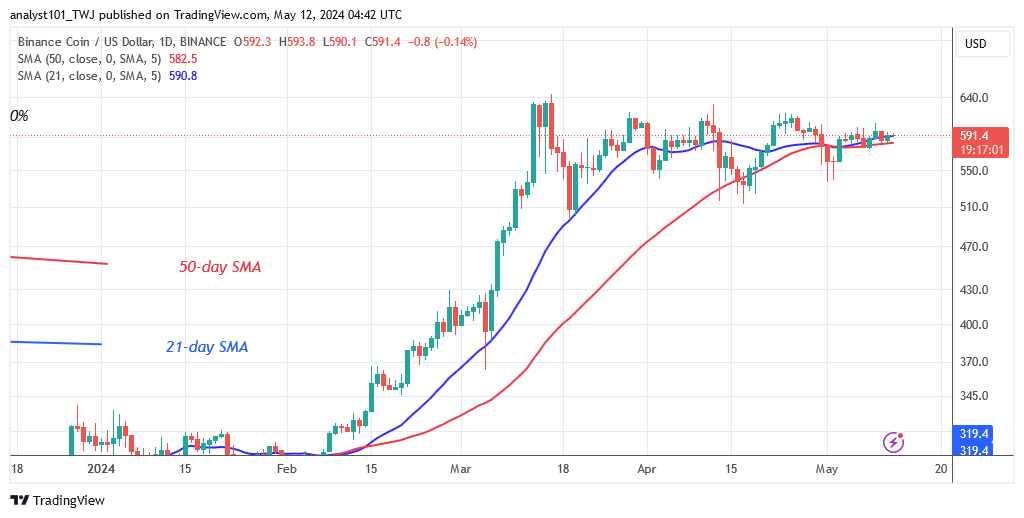
BNB (BNB) Long-Term Analysis: Ranging
The BNB price has remained steady as it consolidates above the $580 support. Previously, the altcoin traded between $520 and $630. Price movement has been restrained by the presence of Doji candlesticks. The cryptocurrency is currently trading in a tight range of $580 to $600. On May 11, BNB fell to a low of $581 as bulls purchased dips.
Buyers have failed to sustain bullish momentum above the moving average lines as the altcoin consolidates above the $500 support. The current exchange rate between BNB and USD is $592.90.
Technical indicators:
Major Resistance Levels – $600, $660, $720
Major Support Levels – $400, $340, $280
BNB (BNB) Indicator Analysis
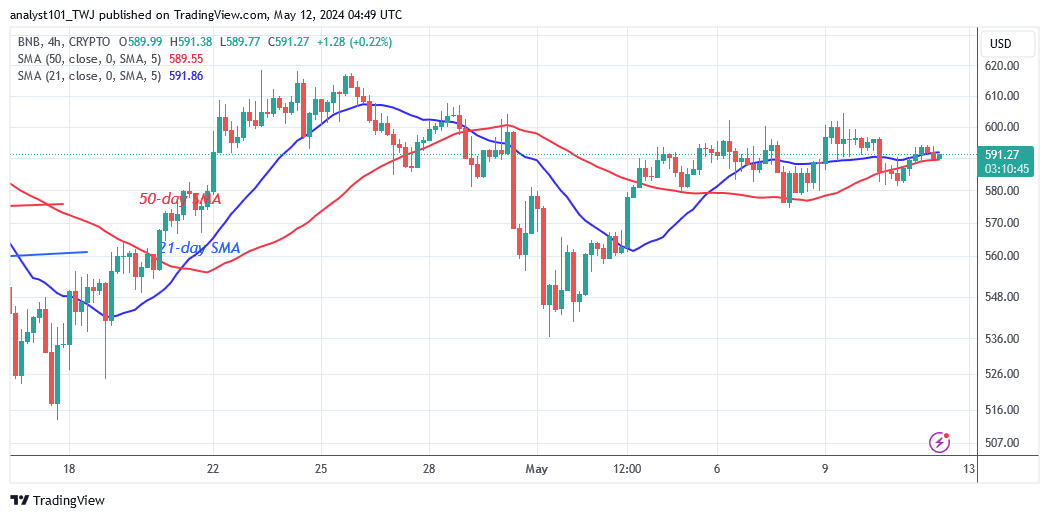
The price bars are located above the horizontal moving average lines, which are consolidating above them. The price movement has been stationary, indicating that the altcoin is stable. Nonetheless, the altcoin will either recover or sink if the consolidation continues.
What Is the Next Direction for BNB (BNB)?
Binance Coin is in a horizontal trend as it consolidates above the $580 support. The presence of Doji candlesticks has limited price movement, both upward and downward. BNB has been trading above the $580 support level for the past 48 hours, with an upward trend that paused near the $595 resistance level. The crypto signal is fluctuating due to the existence of small-body indecisive candlesticks.
You can purchase Lucky Block here. Buy LBLOCK
Note: Cryptosignals.org is not a financial advisor. Do your research before investing your funds in any financial asset or presented product or event. We are not responsible for your investing results