BNB’s Bounces above $520 but Fails to Resume a Positive Trend
Estimated Reading Time: 2 minutes
Don’t invest unless you’re prepared to lose all the money you invest. This is a high-risk investment and you are unlikely to be protected if something goes wrong. Take 2 minutes to learn more

BNB (BNB) Long-Term Analysis: Ranging
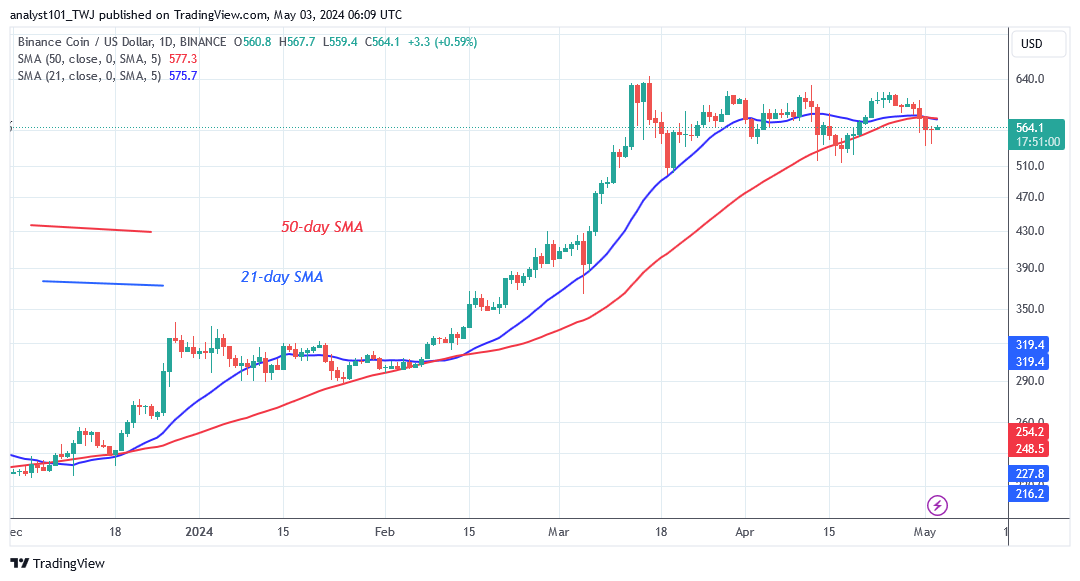
BNB’s price has been in a horizontal trend since March 13, 2024 but fails to resume a positive trend. The cryptocurrency has been trading between $520 and $630. Neither bulls nor bears have been able to exert control above the price trend. On April 25, the altcoin surged to a high of $518 before being repulsed. Bears have continued to sell near the $620 resistance level since March 29.
On each incidence of price rejection, BNB/USD will fall below the moving average lines. This has slowed the cryptocurrency’s upward momentum. If the altcoin had traded above the moving average lines, the overhead resistance of $635 would have been breached. Similarly, on May 1, 2024, BNB dropped to a low of $536. The bulls bought the dips but failed to maintain their bullish momentum above the moving average lines. BNB is currently worth $562.60 as of this writing.
Technical indicators:
Major Resistance Levels – $600, $660, $720
Major Support Levels – $400, $340, $280
BNB (BNB) Indicator Analysis
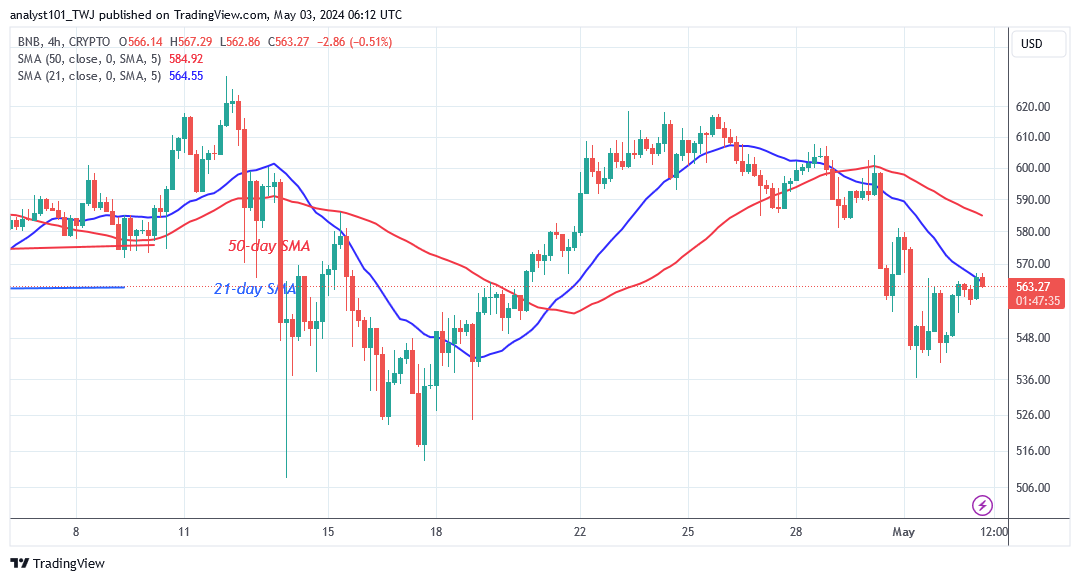
The moving average lines are horizontally flat, indicating a continuing sideways trend. The price bars have continued to oscillate both below and above the moving average lines. Furthermore, the Doji candlesticks have limited the price movement when in a tight range.
What Is the Next Direction for BNB (BNB)?
The crypto asset trades above the $520 support but fails to resume a positive trend. The crypto price is bouncing below the moving average lines, indicating a positive trend. Two long candlestick tails point to the current support level, indicating strong buying pressure near $520. The crypto signal has been range-bound because of its limited range.
You can purchase Lucky Block here. Buy LBLOCK
Note: Cryptosignals.org is not a financial advisor. Do your research before investing your funds in any financial asset or presented product or event. We are not responsible for your investing results