BNB’s Slide Halts above $520 as the Sideways Trend Returns
Estimated Reading Time: 2 minutes
Don’t invest unless you’re prepared to lose all the money you invest. This is a high-risk investment and you are unlikely to be protected if something goes wrong. Take 2 minutes to learn more

BNB (BNB) Long-Term Analysis: Ranging
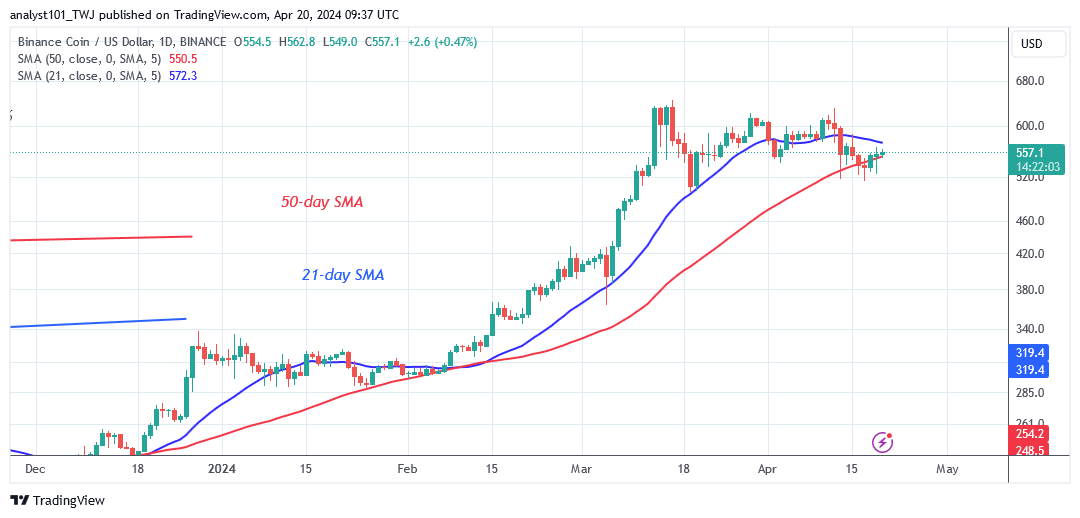
On March 17, 2024, BNB’s upswing stops, and the sideways trend returns. The altcoin reached a peak of $645 during the last rise before being pushed back. BNB fell above the 21-day SMA and entered a price range of $520 to $630. On the downside, bulls have halted the drop above the $520 level, with the altcoin rebounding above the present barrier.
However, if bears break the $520 support level, the altcoin would fall to a low of $420. Nonetheless, the rising trend is meeting an initial resistance at the moving average lines. A price rebound will push the altcoin above the moving average lines and the $630 resistance level. The positive momentum will continue to the high of $645. In the meantime, BNB/USD is worth $570 at the time of writing.
Technical indicators:
Major Resistance Levels – $600, $660, $720
Major Support Levels – $400, $340, $280
BNB (BNB) Indicator Analysis
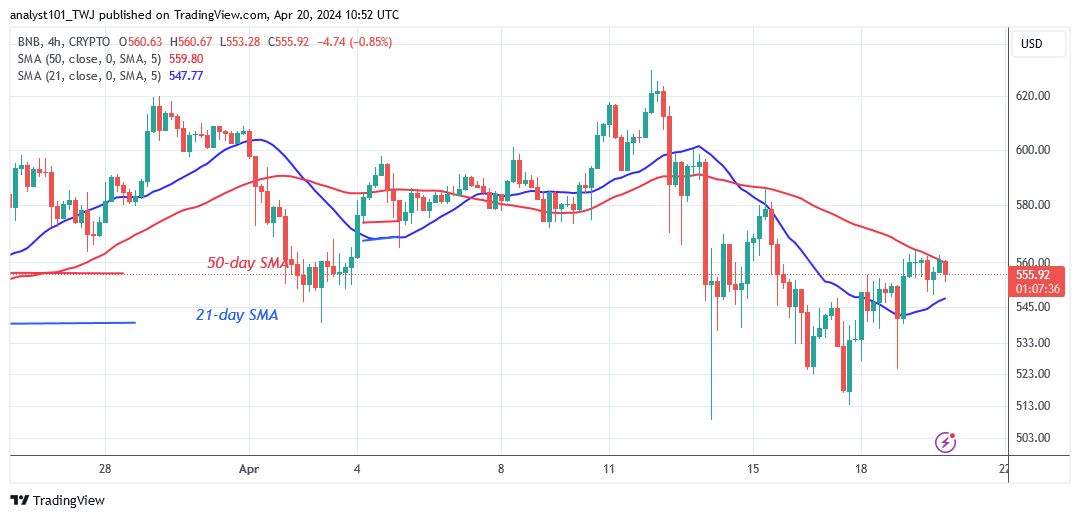
BNB recovered, and the price bars now fall between the moving average lines. The trapping of the price bars implies that the current price levels will remain range bound within a range. The moving average lines have stayed range-bound, indicating a sideways trend.
What Is the Next Direction for BNB (BNB)?
BNB’s sideways trend returns due to the presence of Doji candlesticks. The Doji candlesticks controlled and guided the price movement. Furthermore, either the bulls or the bears must break the range-bound levels for the altcoin to trend. The cryptocurrency signal stayed range-bound as bulls halted the decline above $520.
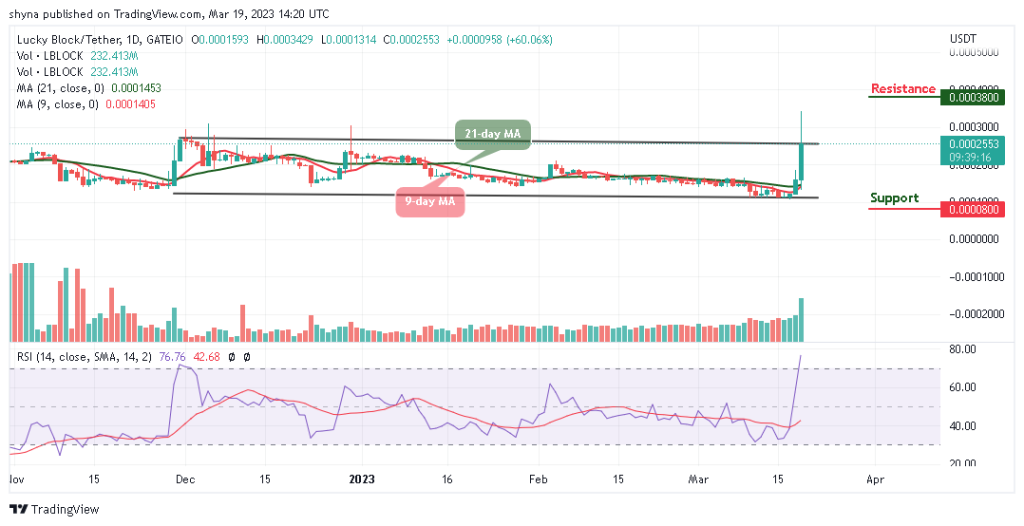
You can purchase Lucky Block here. Buy LBLOCK
Note: Cryptosignals.org is not a financial advisor. Do your research before investing your funds in any financial asset or presented product or event. We are not responsible for your investing
results