Uniswap (UNI) Price Prediction: UNI/USDT Resumes Trading Above the $6.00 Threshold
Estimated Reading Time: 3 minutes
Don’t invest unless you’re prepared to lose all the money you invest. This is a high-risk investment and you are unlikely to be protected if something goes wrong. Take 2 minutes to learn more
Uniswap (UNI) Price Prediction: September 5
The UNI/USDT market recently plunged below the $6.00 price level. However, the market rebounded shortly afterward. Today’s trading session seems to suggest that downward forces are prevailing but on a minimal scale.
UNI/USDT Long-term Trend: Bullish (Daily Chart)
Key Price Levels:
Resistance: $7.00, $8.00, $9.00
Support: $6.00, $5.00, $4.00
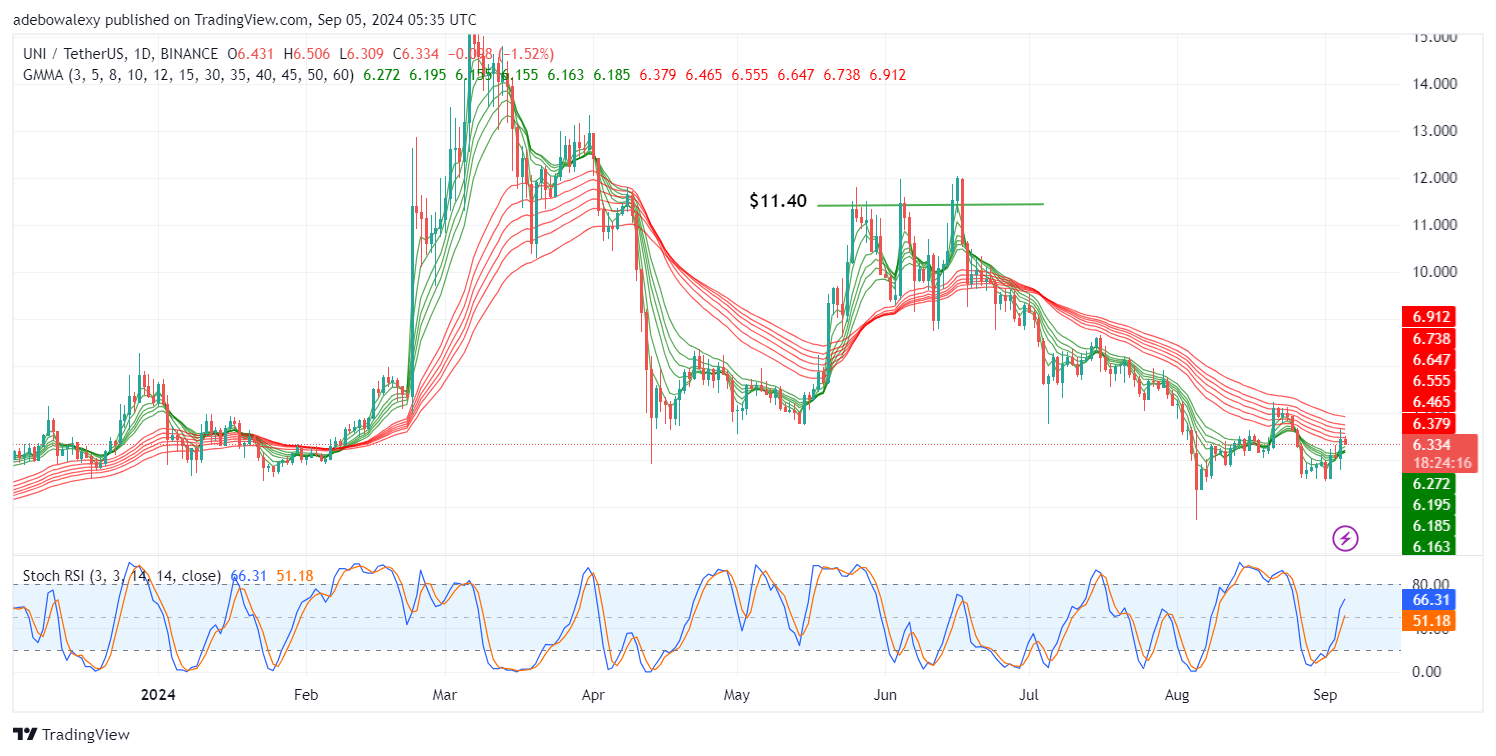
Price activity has crossed above all the green lines of the Guppy Multiple Moving Average (GMMA) indicator. Nevertheless, the current price candle has appeared red, placing the price between the green and red GMMA curves. However, the Stochastic Relative Strength Index (Stochastic RSI) lines maintain an upward trajectory.
Uniswap (UNI) Price Prediction: UNI/USDT Market Has 50/50 Upside Chances
In the Uniswap daily market, it can be observed that downward forces have been exerting pressure since the previous session. This is depicted by the contractions in the corresponding price candle. The current session has continued in the same direction, yielding further downward correction.
Nevertheless, the Stochastic RSI lines remain largely oriented upwards. With the token now trading between the Stochastic RSI lines, market forces seem evenly balanced. At this point, traders may wish to closely observe the market before making trading decisions.
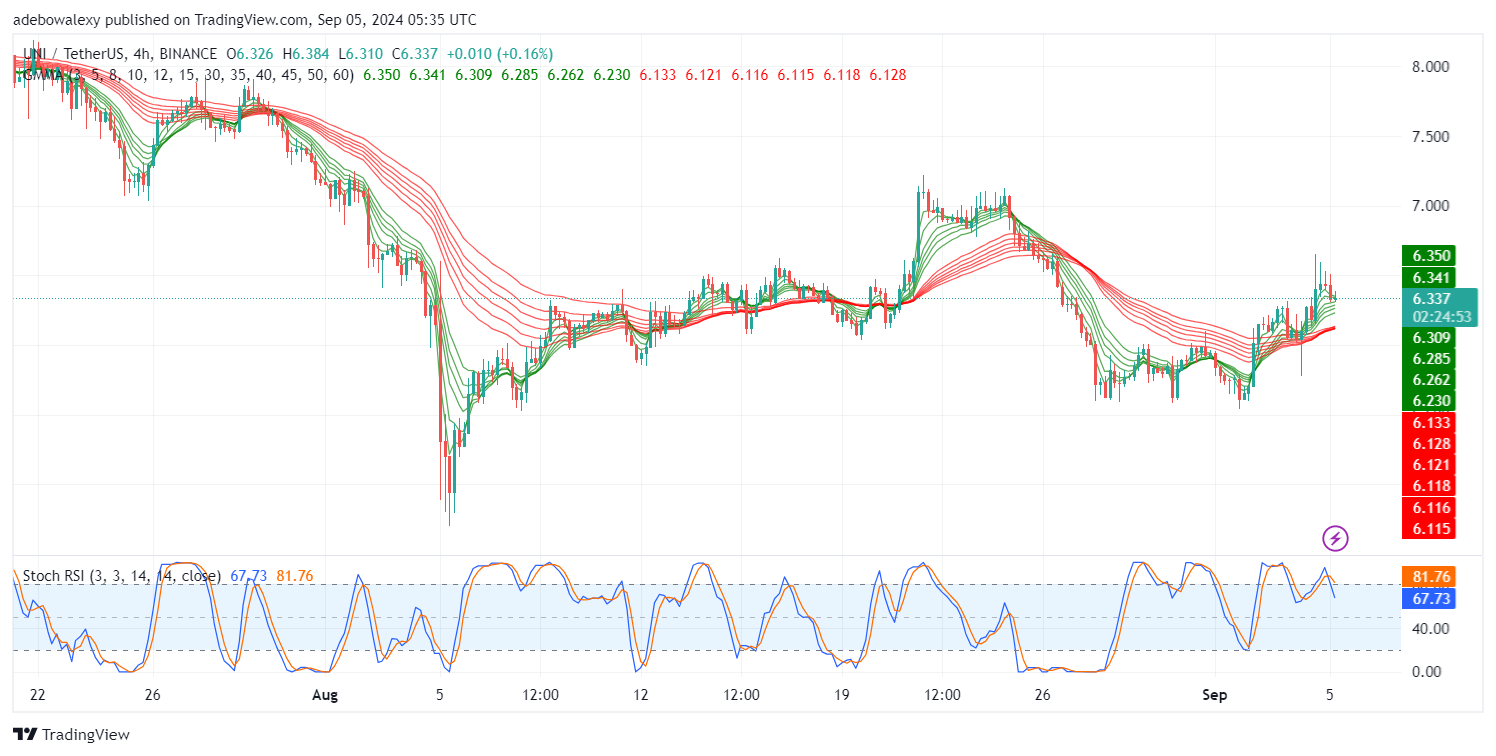
Uniswap (UNI) Price Prediction: UNI/USDT Market Attempting an Upside Continuation (4-Hour Chart)
In the UNI/USDT 4-hour market, price action had previously risen past all the GMMA lines. The $6.500 threshold seems to have presented a strong barrier to further upside progress, leading to a subsequent downward retracement. However, the current session appears to be showing resistance to downward forces. The corresponding price candle has appeared green and is positioned above most of the GMMA indicator lines.
Meanwhile, the Stochastic RSI indicator still reflects a downward trajectory, suggesting a contrary view of the market’s direction. Therefore, traders can wait to see if upward momentum develops during the session. If price action breaks the $6.400 threshold, this could signal a trend continuation toward the $6.500 threshold.