Bitcoin (BTC) Price Prediction: BTC/USDT Seems Heading Towards the $55,000 Mark
Estimated Reading Time: 3 minutes
Don’t invest unless you’re prepared to lose all the money you invest. This is a high-risk investment and you are unlikely to be protected if something goes wrong. Take 2 minutes to learn more

Bitcoin (BTC) Price Prediction: September 4
For eight trading sessions, price action has been trailing below the $60,000 threshold. Additionally, the market has been gradually trending downward. However, the price decline has been more significant between the previous session and the ongoing one.
BTC/USDT Long-term Trend: Bullish (Daily Chart)
Key Price Levels:
Resistance: $57,000, $59,000, $61,000
Support: $55,000, $53,000, $51,000
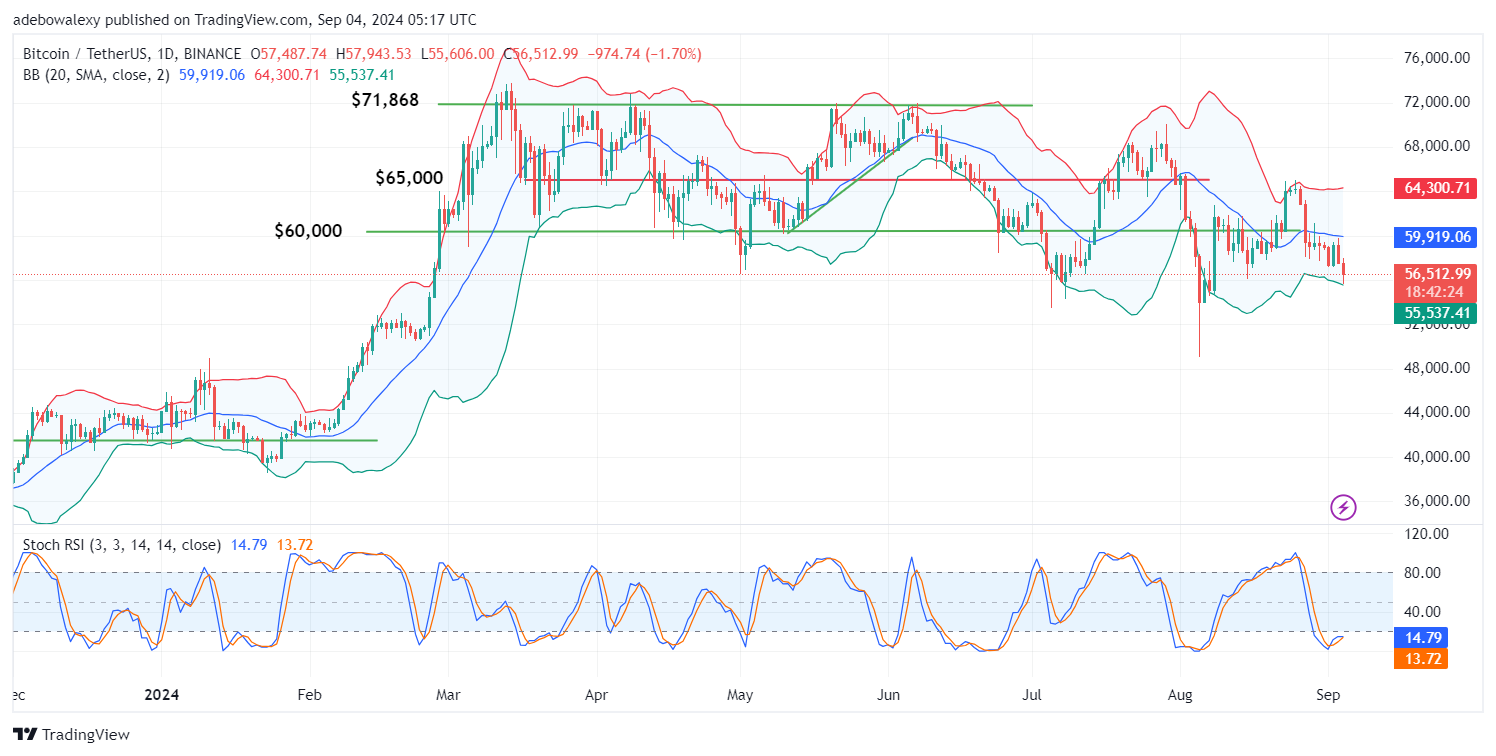
The last price candle on this chart now stands atop the true lowest band of the Bollinger Bands (BB) indicator. Also, the lines of the applied Stochastic Relative Strength Index (Stochastic RSI) are converge for a crossover while projected upwards in the oversold region. The crossover seems imminent given the position of the indicator locked in the oversold region.
Bitcoin (BTC) Price Prediction: Headwind May Gain Momentum in the BTC/USDT Market
Price movement in the BTC/USDT market has touched down on the lowest limit of the BB indicator. This has occurred as bearish momentum increased between the previous session and the ongoing one. Technically, this hints that market participants may already expect lower price levels. Currently, price action is below the middle band of the BB indicator.
Meanwhile, the Stochastic RSI lines can be seen previously rising out of the oversold region. However, the increasing bearish momentum has initiated a crossover on the indicator line. Consequently, bearish momentum seems overwhelming and will most likely drive prices lower.
Bitcoin (BTC) Price Prediction: BTC/USDT Bearish Odds Increase (4-Hour Chart)
The strengthening bearish momentum has kept price action hugging the lowest limit of the Bollinger Bands indicator. The last price candle on the Bitcoin’s 4-hour chart has appeared below the lowest limit of the BB indicator. Also, the BB indicator lines are widening due to the increasing pressure on the indicator limits. The Stochastic RSI lines are dropping steeply into the oversold region as well.
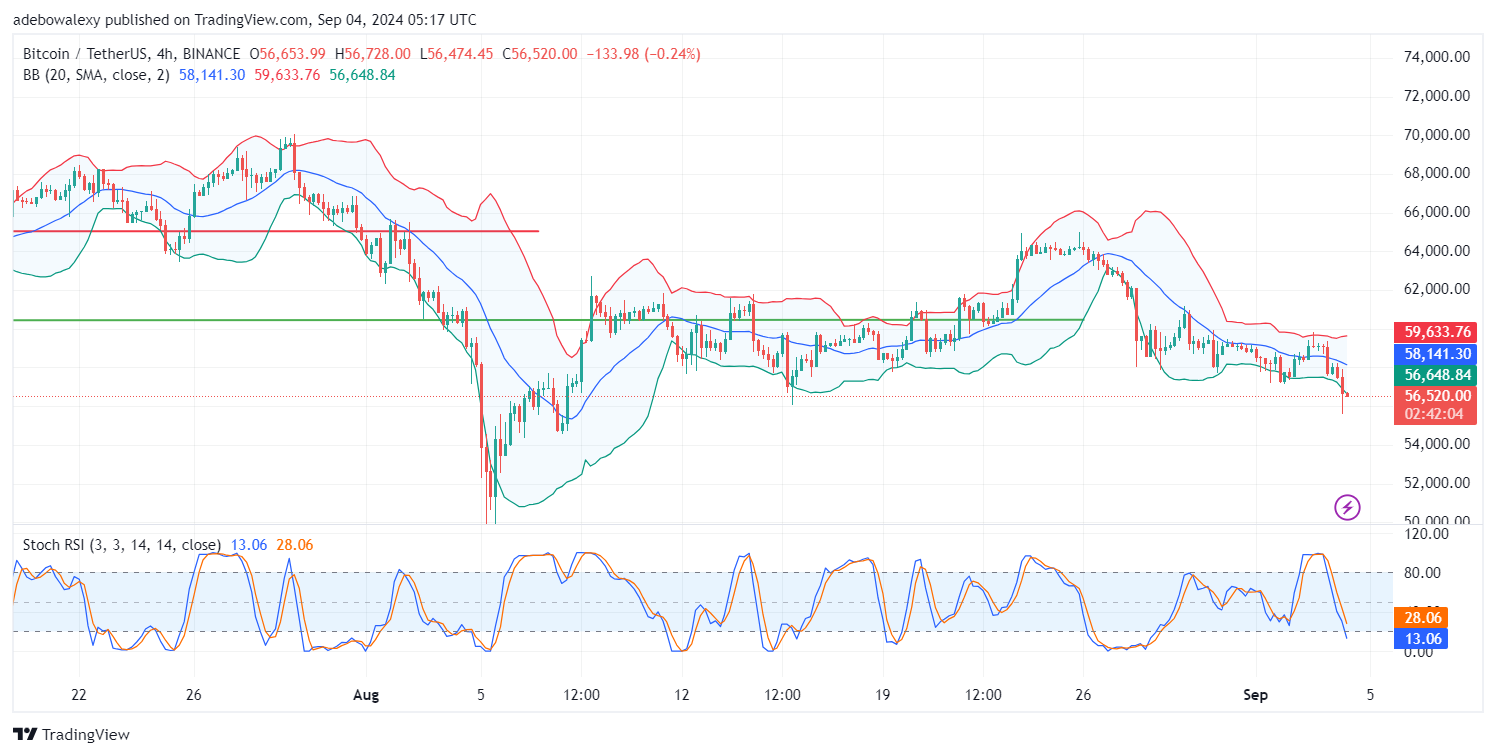
All the signs from the daily and 4-hour charts seem consistent with the fact that price movement has a bearish trajectory. This suggests that the market may reach the $55,000 mark for support. The market may even break below this threshold should it fail to attract enough buyers, as dictated by fundamentals.