Pyth Network (PYTH/USD): Bulls Aim to Sustain Market Strength
Estimated Reading Time: 3 minutes
Don’t invest unless you’re prepared to lose all the money you invest. This is a high-risk investment and you are unlikely to be protected if something goes wrong. Take 2 minutes to learn more
After rallying to the $0.25 level, where the market briefly peaked, Pyth Network is now stabilizing around the $0.22 zone as buyers and sellers seek equilibrium. Although the sustainability of this level remains uncertain, recent price action reveals a notable uptick in bullish momentum. This move marks a clear breakout from the previous consolidation phase, signaling what could potentially be the early stages of a bullish shift in market sentiment.
Pyth Network (PYTH/USD) Market Data
- PYTH/USD Price Now: $0.225
- PYTH/USD Market Cap: $1.3 billion
- PYTH/USD Circulating Supply: 5.7 billion PYTH
- PYTH/USD Total Supply: 9.99 billion PYTH
- PYTH/USD CoinMarketCap Ranking: #66
Key Levels
- Resistance: $0.23, $0.25, and $0.30
- Support: $0.11, $0.10, and $0.09
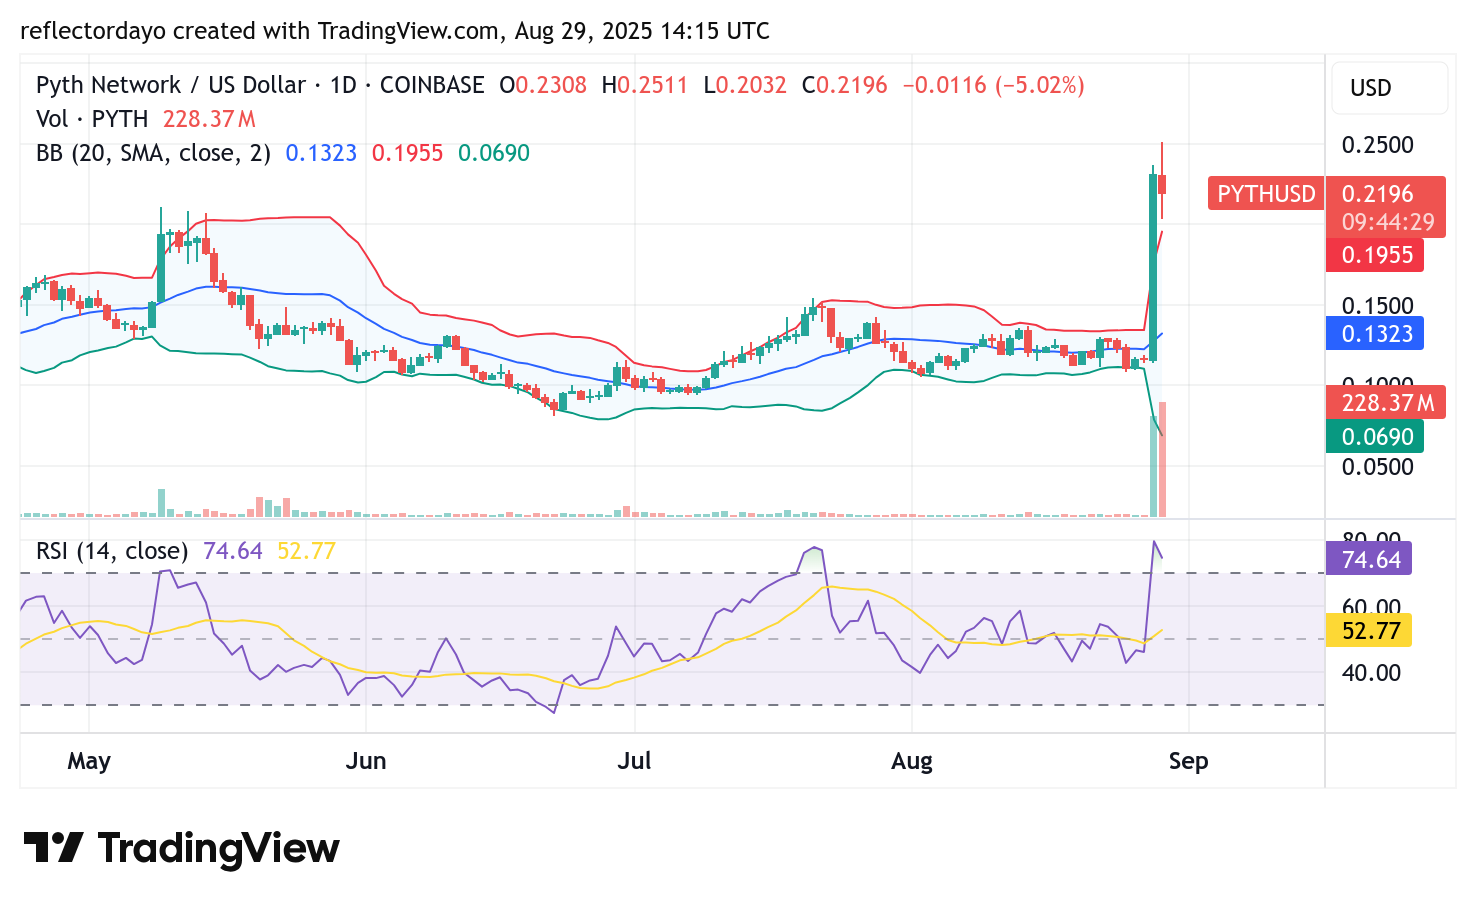
Daily Chart Outlook: Overbought Signals and Rising Volatility
The strong bullish run that began yesterday appears to carry potential fundamental drivers; however, technical indicators are flashing overbought conditions. Both the Bollinger Bands and the Relative Strength Index (RSI) suggest that Pyth Network is stretched, creating room for a corrective move.
Despite remaining in a strong buy zone in today’s session, the pullback from the $0.25 resistance level highlights profit-taking by some traders. At the same time, new buyers are stepping in around the $0.20 support, seeking entry at lower levels. This clash of sentiments is reflected in the emergence of a spinning top candlestick, signaling indecision in the market.
While volatility remains elevated, bullish bias has so far managed to keep the price buoyant above the $0.20 threshold. Sustaining this level will be crucial for maintaining momentum in the short term.

PYTH/USD 4-Hour Chart Analysis
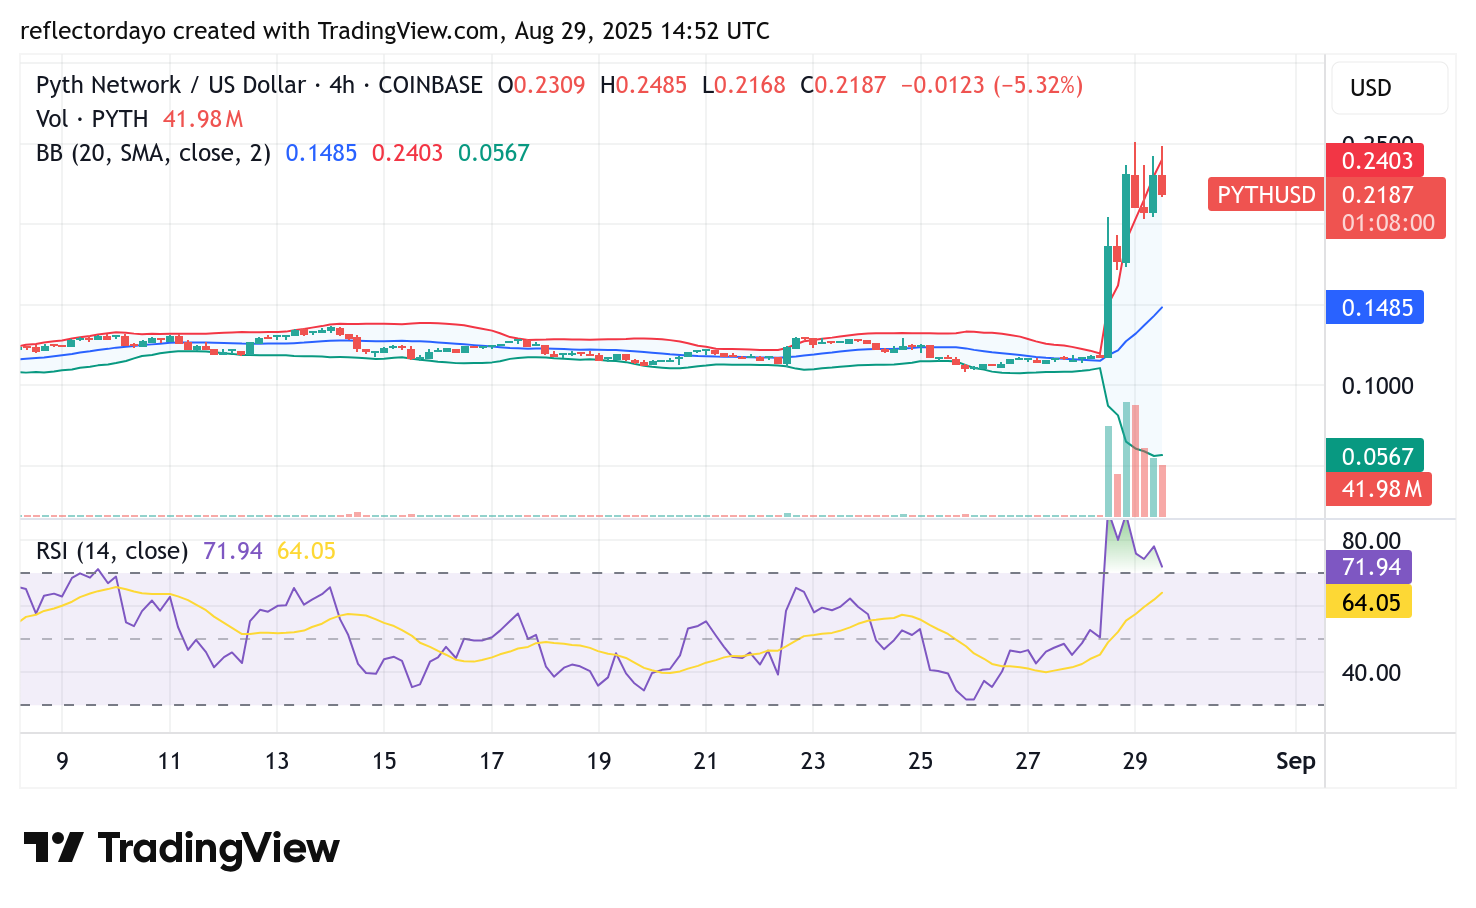
On the 4-hour chart, Pyth Network appears to be consolidating, with price action attempting to stabilize around the $0.22 level. Despite this sideways movement, the RSI continues to signal overbought conditions, highlighting a strong underlying bullish bias. This suggests that traders may be aiming to establish $0.22 as a new support level.
At the same time, the recent pullback reflects early signs of cooling momentum after yesterday’s sharp rally. The RSI is beginning to ease slightly, implying that short-term traders may be scaling back positions. Nevertheless, as long as the price remains above the $0.20 support, sentiment in the near term is likely to remain bullish. A decisive breakout above the $0.23–$0.25 resistance zone could serve as the next trigger for renewed upward momentum.