Hyperliquid (HYPE/USDT) Faces Continued Bearish Pressure with Strong Reversal Potential at $36.49
Estimated Reading Time: 3 minutes
Don’t invest unless you’re prepared to lose all the money you invest. This is a high-risk investment and you are unlikely to be protected if something goes wrong. Take 2 minutes to learn more

The market for Hyperliquid against Tether has shown mixed signals in recent times. The pair’s price has faced a significant pullback after an attempt at recovery from the initial market crash. Both the daily and smaller timeframes indicate sellers’ domination as the price tends towards the lower segment of the Bollinger Bands.
Recently, the Stochastic RSI on the daily chart signals improvement is near, but activities in the smaller session of the market suggest the pair might need to further extend to the south.
Currently, Hyperliquid trades at $38.775 with only 268.38 thousand traded volumes after mid-day.
Technical Indicators
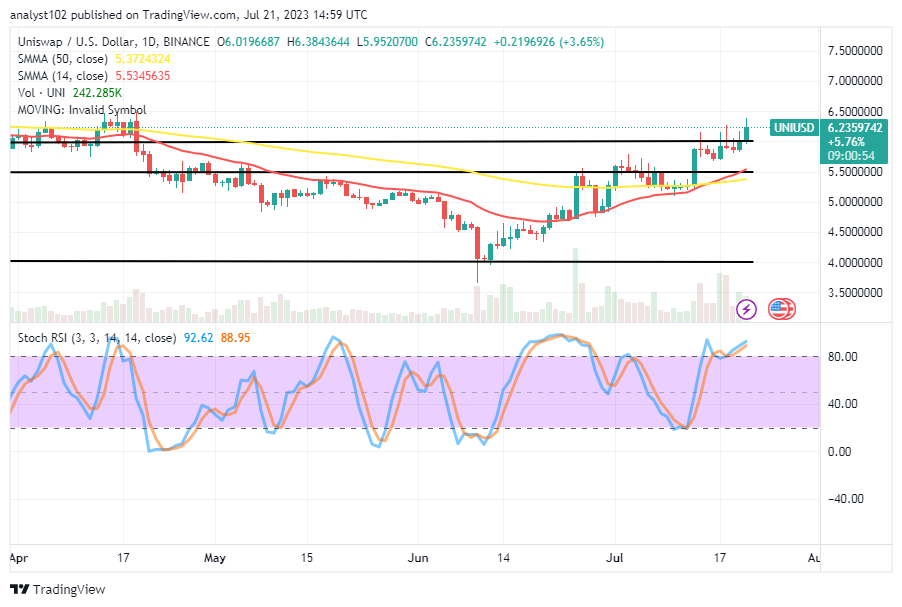
Major Resistance Levels: $44.556, $52.622, and $60.000
Major Support Levels: $36.489, $35.630, and $31.000
Hyperliquid Technical Analysis
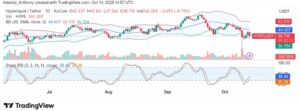
Technically, Hyperliquid against Tether appears bearish, as the recent bullish pressure was dissolved by a stronger resistance around $44.556. Meanwhile, the price seems to be dwindling while the Bollinger Bands seem to be expanding, suggesting increasing sell pressure as the price opens a new position more than 4% below its opening price.
However, the Stochastic RSI signals recovery from the oversold condition despite the recent sell condition. To this end, if the $36.49 fails to absorb the current sell pressure, further fall in value will be recorded.
$HYPE — WEDGE PATTERN SIGNALING REVERSAL$HYPE retraced sharply after hitting the resistance line, shaping a clean descending wedge formation. The price is consolidating near the wedge’s lower boundary, showing early signs of exhaustion in bearish momentum. A confirmed break and… pic.twitter.com/0nZM5Ungdw
— Trường Giang (@TruongGiang0603) October 14, 2025
Moreover, @TruongGiang0603 has pointed to the reaction recorded by Hyperliquid after operating close to a resistance level. Meanwhile, it is clear that the token appears to be operating within a wedge formation, with the price oscillating near the lower point. As it stands, the analyst is of the opinion that if the token can bounce from the current support area, the further southbound movement would be invalidated.
HYPE/USDT Analysis: Is Short-term Reversal Possible?
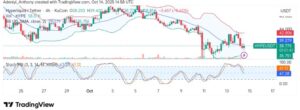
The trading condition for HYPE/USDT on the 4-hour chart appears with no difference from the larger session, as the trading price pierces through the dynamic 20-SMA band. So far in this timeframe, HYPE has recorded more than 8% price depreciation against Tether as the Stochastic oscillator signals more to come.
As it stands, though the market looks bearish, it could set the stage for bullish action. To this end, given the near oversold condition of the momentum oscillator, the possibility of a reversal above $39.22 would invalidate the impending southbound move. However, a break below $36.49 would favor the bears.
You can purchase crypto coins here. Buy Crypto