Band Protocol (BANDUSD) Is Set to Have Another Go at the $1.970 Resistance Level
Estimated Reading Time: 2 minutes
Don’t invest unless you’re prepared to lose all the money you invest. This is a high-risk investment and you are unlikely to be protected if something goes wrong. Take 2 minutes to learn more

Free Crypto Signals Channel
Market Analysis – BANDUSD Is Set to Test the $1.970 Resistance Again
BANDUSD is set to rise towards the $1.970 resistance level again to find pockets of weakness to exploit. The coin has attempted to violate this resistance level in previous months but has thus far been unsuccessful. BANDUSD is gunning to test the resistance again after another recent rejection. The price dropped to the $1.300 support level and is rallying from there.
BANDUSD Critical Levels
Resistance Levels: $3.050, $1.970
Supply Levels: $1.300, $0.005
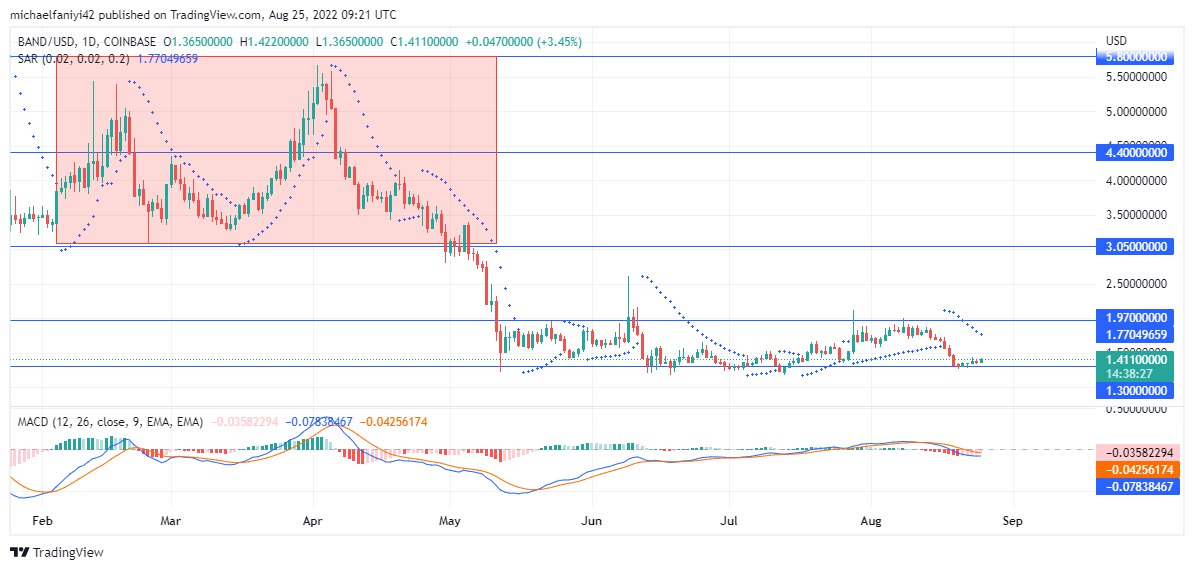
It has been a bear market since the price began a downtrend in April last year. At times, the buyers attempt to stop the decline by standing in the way. In all the instances, the best that happened was for the market to breach a few price levels and then slump downwards. Most other times, the price just plummeted downward to continue the bearish dominance.
This is the method by which the coin has reached the $1.300 demand level. It seems the trend will continue as before, except the buyers do something drastic from this level. The MACD (Moving Average Convergence Divergence) lines have dipped below the zero level. Meanwhile, the Parabolic SAR (Stop and Reverse) dots are aligned above the 30-minute candles.
Market Expectation
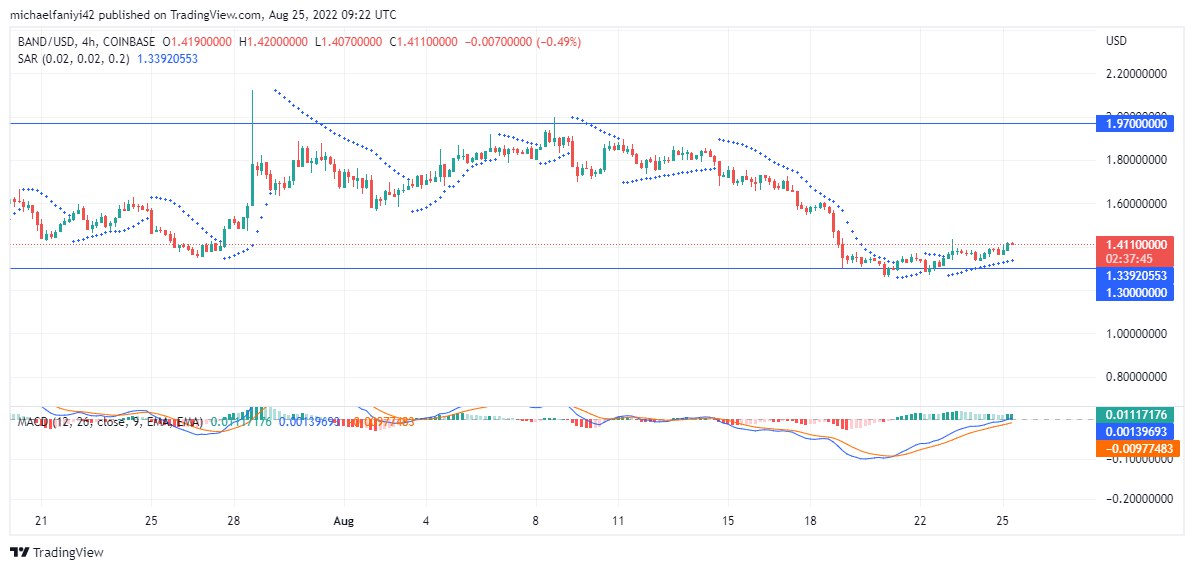
Bearish pressure has brought the price to its current level. BANDUSD is now ranging, as shown on the 4-hour chart. As a result, the Parabolic SAR dots are alternating around the candlesticks. The coin has fallen to the support level and is set to bounce upward from it. The 4-hour MACD indicator is following that of the daily chart, in that the MACD lines have dipped below the zero level and have turned in an upward direction. The Price is set to break through to $3.050.
You can purchase Lucky Block here. Buy LBLOCK
Note: Cryptosignals.org is not a financial advisor. Do your research before investing your funds in any financial asset or presented product or event. We are not responsible for your investing results.