Polkadot Retests Oversold Area as It Faces Rejection at $4.30
Estimated Reading Time: 2 minutes
Don’t invest unless you’re prepared to lose all the money you invest. This is a high-risk investment and you are unlikely to be protected if something goes wrong. Take 2 minutes to learn more

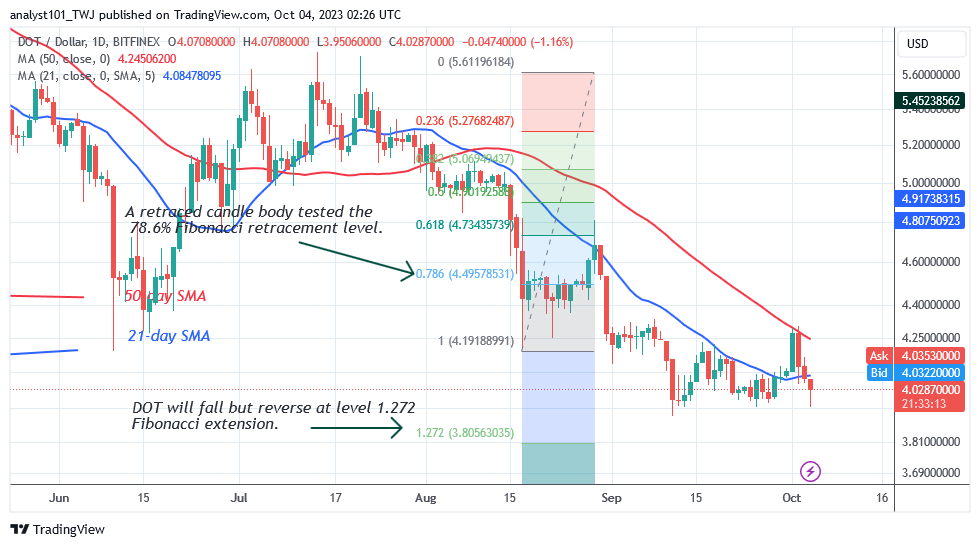
Polkadot (DOT) Long-Term Analysis: Bearish
Polkadot’s (DOT) price has recently returned to its previous low as it faces rejection at $4.30. A price rebound and subsequent decrease drove the altcoin to the previous low. The 21-day SMA has blocked additional price increases in the recent price action. On September 29, however, the bulls managed to surpass the 21-day SMA and reach a high of $4.29.
The 50-day SMA stopped the positive momentum, which caused the crypto to fall. Polkadot has fallen to the low of $3.95. The price indicator predicts that the altcoin will fall, but then rise to a level of $3.80.
Technical indicators:
Major Resistance Levels – $10, $12, $14
Major Support Levels – $6, $4, $2
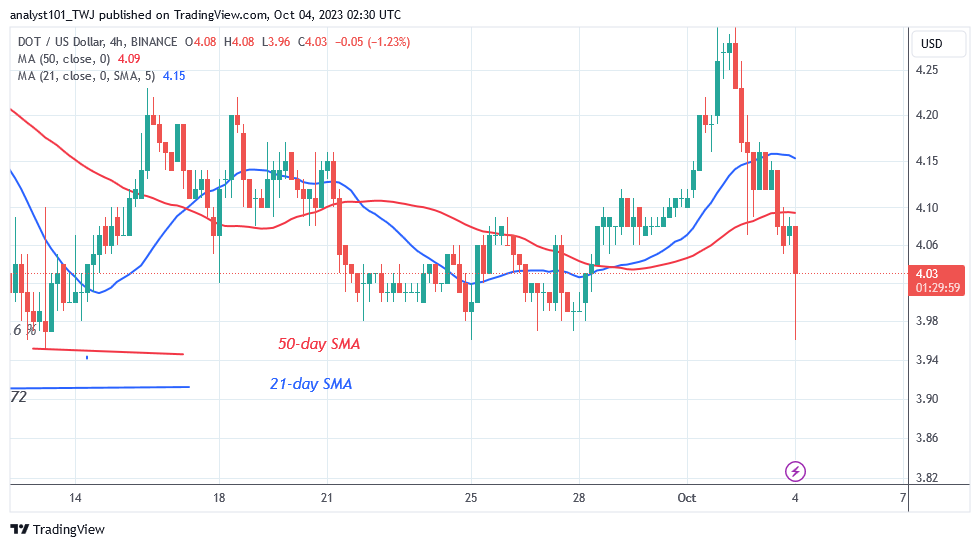
Polkadot (DOT) Indicator Analysis
The price bars are currently below the moving average lines after being captured on October 1. The cryptocurrency will try to fall when price bars are below the moving average lines. The downward-sloping direction of the moving average lines indicates a decline. The oversold area of the market has been visited once more by Polkadot.
What Is the Next Direction for Polkadot (DOT)?
Polkadot has returned to the oversold section of the market as it faces rejection at $4.30. Lower price points are perhaps more likely to draw buyers. As Bull purchased the dips on September 11, Polkadot fell below its prior low of $3.91. The 21-day SMA, however, rejected the rising movements. The altcoin has since retraced and is currently circling above the $4.00 support.
You can purchase Lucky Block here. Buy LBLOCK
Note: Cryptosignals.org is not a financial advisor. Do your research before investing your funds in any financial asset or presented product or event. We are not responsible for your investing results