Polkadot Is in a Narrow Range as It Prepares to Rebound
Estimated Reading Time: 2 minutes
Don’t invest unless you’re prepared to lose all the money you invest. This is a high-risk investment and you are unlikely to be protected if something goes wrong. Take 2 minutes to learn more

Polkadot (DOT) Long-Term Analysis: Bearish
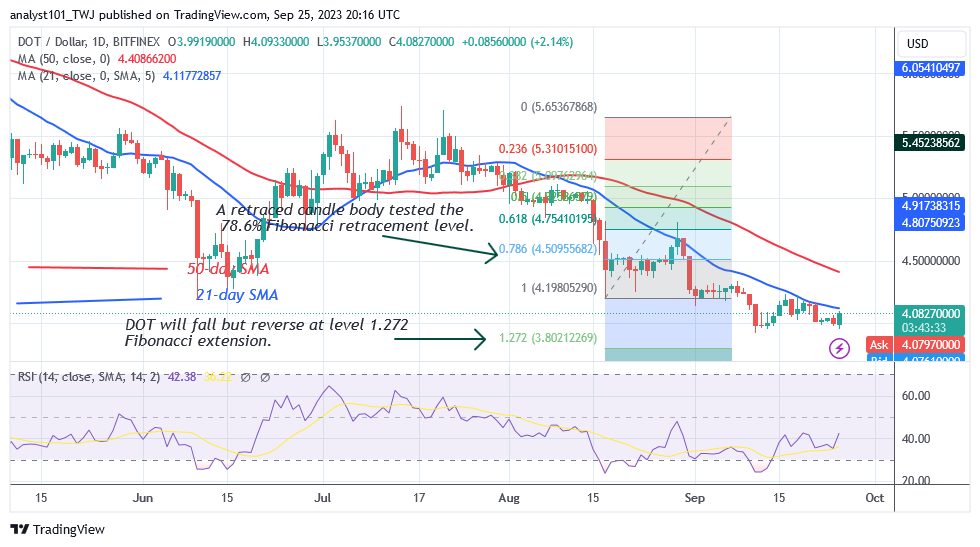
Polkadot (DOT) has maintained its existing pricing range of $3.91 to $4.20 as it prepares to rebound . The 21-day SMA, or resistance, around $4.15 has halted the upward price trend. The altcoin is now rising, but it is being rejected at the 21-day SMA. The bears are attempting to push the price below the current support level of $3.91.
The current support is a market-oversold area. If altcoin retraces above the existing support, the cryptocurrency asset will rebound. It is projected that the price will rise above the moving average lines. If the bears break through the current support, DOT will decline but reverse at the 1.272 Fibonacci extension, or $3.80. Polkadot is now trading at $4.06 at the time of writing.
Technical indicators:
Major Resistance Levels – $10, $12, $14
Major Support Levels – $8, $6, $4
Polkadot (DOT) Indicator Analysis
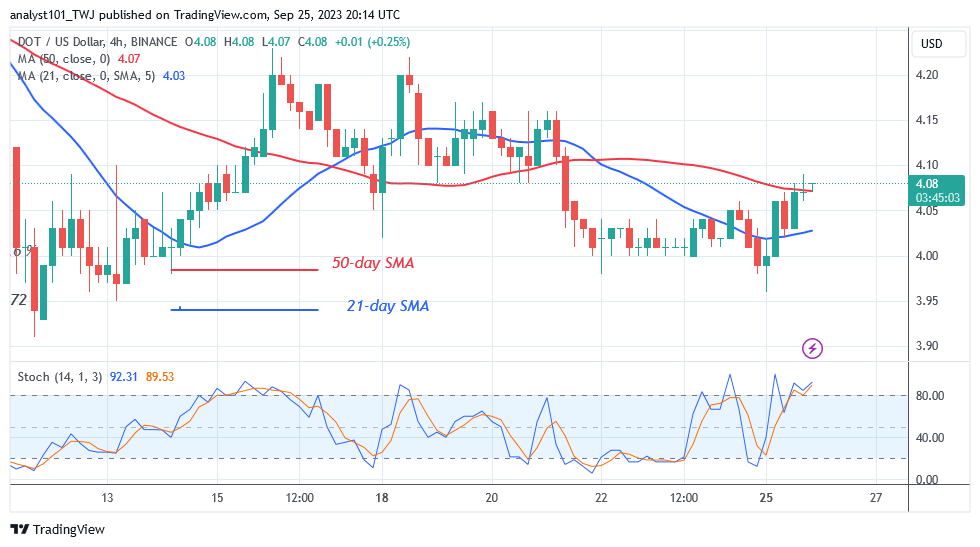
The altcoin is correcting upward as it crosses the Relative Strength Index level of 40 for period 14. The 21-day SMA limits the price bars to a range. Currently, the altcoin has reached an overbought market region. It is below the daily Stochastic level of 80. The DOT price will decline from its recent high as it enters the overbought zone.
What Is the Next Direction for Polkadot (DOT)?
Polkadot is currently trading in the $3.91 to $4.20 price range as it prepares to rebound . The 21-day SMA has tightened the current range. Today, the cryptocurrency’s price is rising as it looks to break through the 21-day SMA. If the price breaks above the 21-day SMA, the altcoin will resume positive momentum.
The bullish momentum will continue to the 50-day SMA high. Where it fails to break the recent high, the range-bound trend will continue.
You can purchase Lucky Block here. Buy LBLOCK
Note: Cryptosignals.org is not a financial advisor. Do your research before investing your funds in any financial asset or presented product or event. We are not responsible for your investing results