Polkadot Is Oversold as It Drops to Its Previous Low of $3.91
Estimated Reading Time: 2 minutes
Don’t invest unless you’re prepared to lose all the money you invest. This is a high-risk investment and you are unlikely to be protected if something goes wrong. Take 2 minutes to learn more

Polkadot (DOT) Long-Term Analysis: Bearish
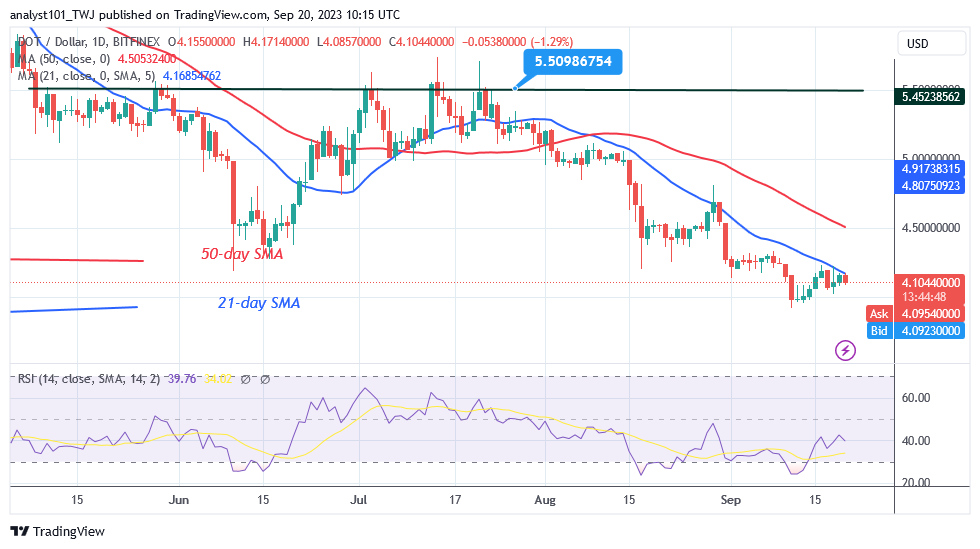
Polkadot (DOT) has continued to fall in price as it drops to its previous low of $3.91. The downtrend has been making a succession of lower highs and lower lows since August 17. On September 11, the crypto fell to a low of $3.91 as bulls bought dips. The altcoin recovered but became caught at the $4.20 resistance or the 21-day SMA. The recent high was in an overbought market zone.
Today, DOT/USD is falling as it faces rejection at the 21-day simple moving average. If the bears break through the current support level of $3.91, the altcoin will fall even deeper. Meanwhile, the altcoin is falling, although it is still trading above the $4.00 support level.
Technical indicators:
Major Resistance Levels – $10, $12, $14
Major Support Levels – $8, $6, $4
Polkadot (DOT) Indicator Analysis
The altcoin recovered to the Relative Strength Index level of 40 for period 14. The price bars are being rejected at the 21-day SMA, which will cause the cryptocurrency to fall even more. If the price breaks above the 21-day simple moving average, the upward trend will resume. The altcoin is in a negative trend below the daily Stochastic threshold of 20.
It indicates that the market has reached the oversold region.
What Is the Next Direction for Polkadot (DOT)?
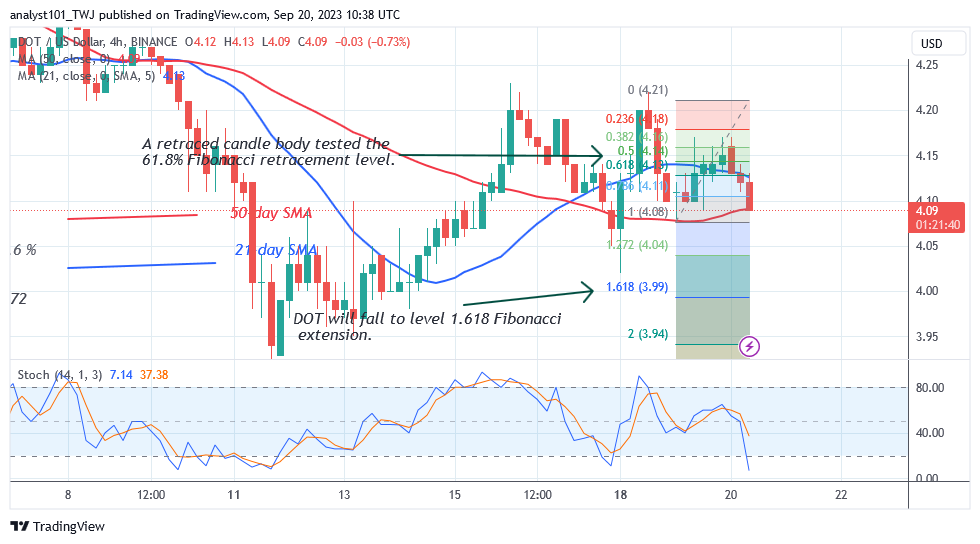
The cryptocurrency asset is falling as it drops to its previous low of $3.91. Polkadot has touched the bottom price of $3.91 but has now corrected to a high of $4.20. The altcoin corrected upward after the September 19 fall, and a retraced candle body tested the 61.8% Fibonacci retracement level. According to the correction, DOT will fall to the 1.618 Fibonacci extension level, or $3.99.
You can purchase Lucky Block here. Buy LBLOCK
Note: Cryptosignals.org is not a financial advisor. Do your research before investing your funds in any financial asset or presented product or event. We are not responsible for your investing results