Uniswap (UNI/USD) Price Waxes Higher Lows, Keeping Above $5
Estimated Reading Time: 4 minutes
Don’t invest unless you’re prepared to lose all the money you invest. This is a high-risk investment and you are unlikely to be protected if something goes wrong. Take 2 minutes to learn more
Uniswap Price Prediction – December 23
Since there has been a sudden swing up in the crypto economy some days before this month of December, given that the UNI/USD price waxes higher lows around the line of $6, keeping above $5 portends that buyers are struggling to push more higher than the previous peak point.
The $7 market value line continues to be the key obstacle that bulls must overcome because bears often oppose any force that may eventually emerge in the area. Now that things are as they are, the velocity pace determiner indicator has reached a midpoint that will not induce a move either way. As a result, the location of the stochastic oscillators will be crucial in deciding the process’s next move and how best to couple it with a price action.
UNI/USD Market
Key Levels:
Resistance levels: $7, $8, $9
Support levels: $5, $4.50, $4
UNI/USD – Daily Chart
The UNI/USD daily chart showcases the crypto market’s waxing lows, keeping above the line of $5.
Over a long time, a bullish path was made by the emergence of a candlestick sprining from around the point of $5 to create the present condition. The Bollinger Band indicators have the middle trend line tightly swerving around the point of $6, with the upper part positioned closely beneath the point of $7, leaving the lower part to stay in a supportive format closely below the second value mentioned earlier. The stochastic oscillators are in a northbound-crossing mode from the oversold region to place at 40. That implies that the market is striving for further ups.
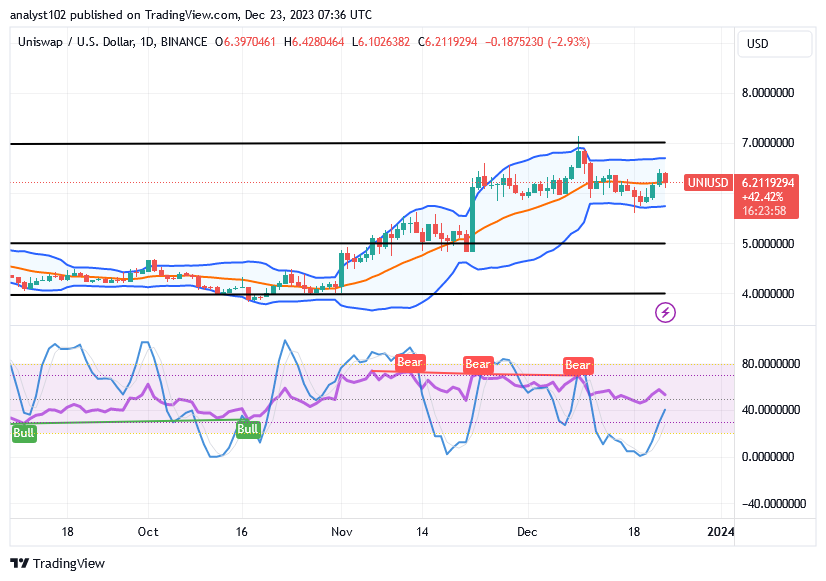
Which tradeline is most likely to be a key area that bears in the UNI/USD market will eventually try to fight back against?
In the long run, if there is a critical line for the UNI/USD market sellers to push southward against, it will be $5, as the crypto trade waxes higher lows toward the resistance point of $7, keeping above the point mentioned earlier.
Based on the Bollinger Band indicators, the trade area that is close to the lower Bollinger Band trend line seems to be the best place to execute long-term position orders. In the worst case, any attempt to see the price move below that point and towards the south might allow the cryptocurrency economy to acquire momentum in relation to the US dollar’s valuation.
Bears may need to wait for better conditions to indicate that the stochastic oscillators are in the overbought region and a string of rejections has begun to play out at high trading spots before considering placing a shorting order, according to technical analysis predicting the tendency to get bears back on track in this market.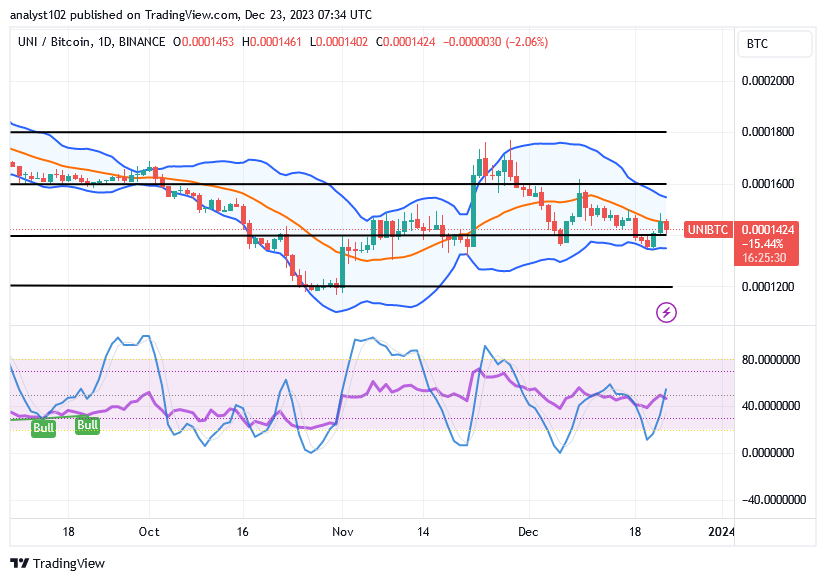
UNI/BTC Price Analysis
In contrast, the Uniswap’s price waxes higher from a lower zone of a former bullish candlestick against the worth of Bitcoin, keeping above the lower Bollinger Band.
The stochastic oscillators’ posture formation indicates that a buying motion is more likely to be successful in the ensuing operations. The trend lines of the Bollinger Bands are bending slightly to the south, suggesting that a bullish flag pattern may be taking shape. And that will stay true as long as it is impossible for the counter-crypto economy to breach the lower end of the indications at any point in time when it comes to the base trading instrument.
Note: Cryptosignals.org is not a financial advisor. Do your research before investing your funds in any financial asset or presented product or event. We are not responsible for your investing results.
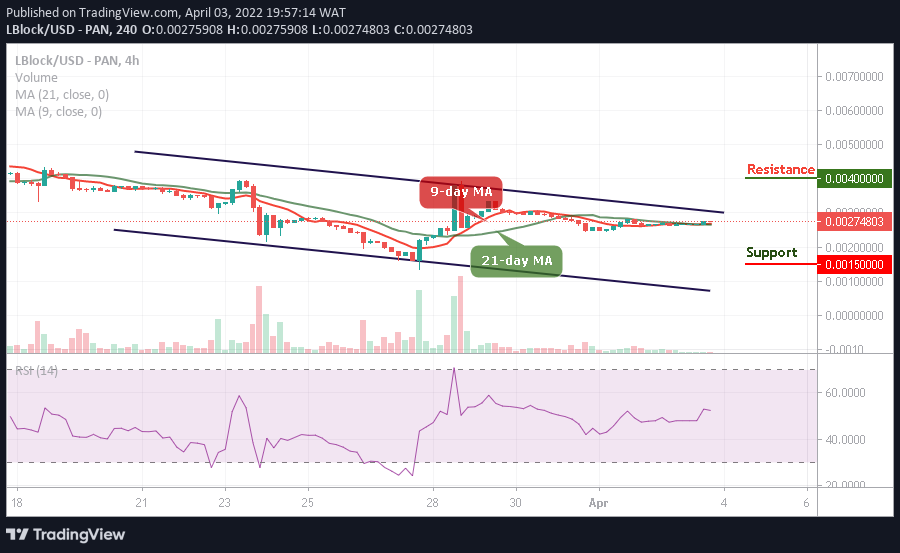
You can purchase Lucky Block here. Buy LBLOCK