Bitcoin (BTC/USD) Price Attempts Decline Closely Below $45,000
Estimated Reading Time: 3 minutes
Don’t invest unless you’re prepared to lose all the money you invest. This is a high-risk investment and you are unlikely to be protected if something goes wrong. Take 2 minutes to learn more

Free Crypto Signals Channel
Bitcoin Price Prediction – February 16
There has been another round of rebounding trading processes in the BTC/USD market activities as the crypto-economic price attempts decline closely below $45,000. The situation has prompted a high and low value of $44,555 and $43,878 at a negative percentage of 1.07 as of writing.
BTC/USD Market
Key Levels:
Resistance levels: $45,000, $47,500, $50,000
Support levels: $42,500, $40,000, $37,500
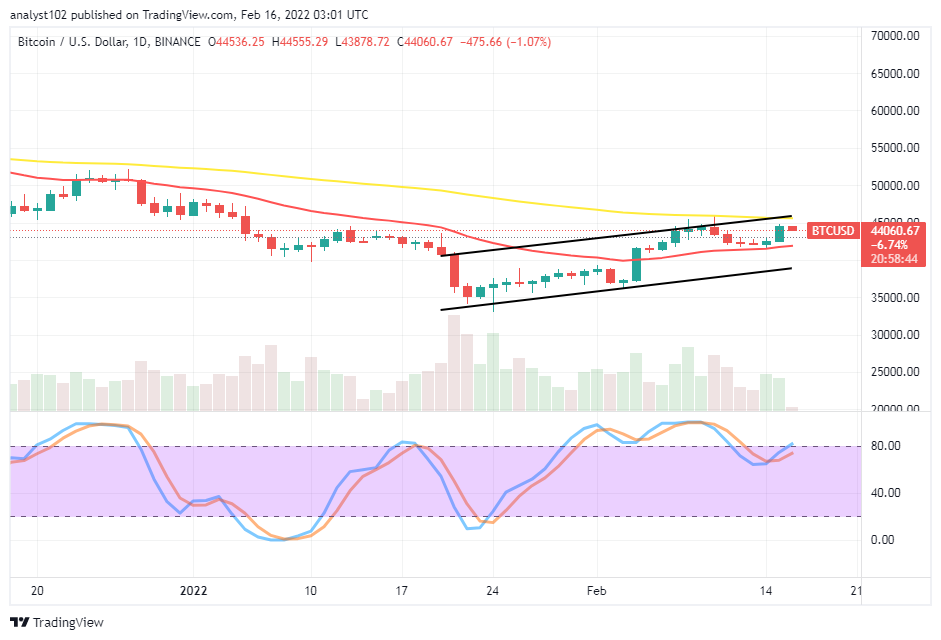
BTC/USD – Daily Chart
The BTC/USD daily chart showcases the crypto market price attempts decline closely below the $45,000 resistance trading level a bit beneath the bigger SMA indicator. The 50-day SMA trend line is above the 14-day SMA trend line. The bullish channels drew to keep a close tab on the pace of rallying motion that price keeps. The Stochastic oscillators have initially crossed southbound from the overbought region. And they now attempt moving back into the overbought region, indicating a return of an upward force.
Are there brighter chances to get more ups and downs in the BTC/USD market operations as the crypto-economic price attempts decline closely below $45,000?
It appears an indication still aligns with a buying spree that the BTC/USD market may experience some levels of ups purposely to find strong resistance at a higher trading zone as the crypto-economic price attempts decline closely below $45,000. From the technical point of viewing, traders willing to follow a sudden spike against the trend line of the 50-day SMA may get trapped by the bulls’ trap as there can be a reversal against the trend in no time.
On the downside of the technical analysis, the BTC/USD market short-position takers may have to brace up by being on the alert to spot an active price movement reversal pattern at a higher trading level to launch a sell order. The crypto business operations may not survive pushes especially, above the $45,000. In other words, trading above the value line is most liable to result in a downward falling pressure afterward.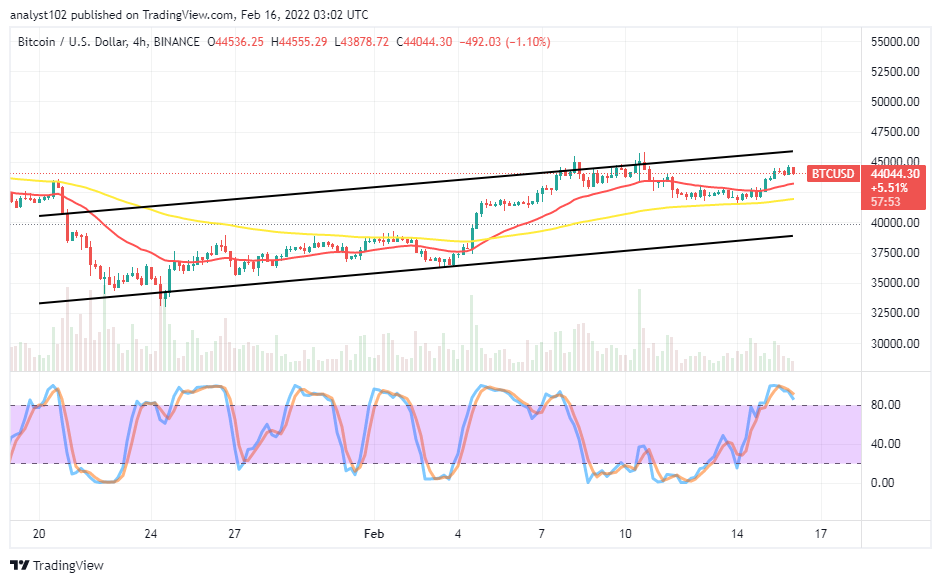
BTC/USD 4-hour Chart
The BTC/USD medium-term chart reveals the crypto-economic price attempts decline closely below $45,000 after variant candlesticks denoting a rebounding moving mode. The bullish channel trend lines embodied SMA trend lines. The 50-day SMA indicator is beneath the 14-day SMA indicator. The Stochastic Oscillators are in the overbought region, trying to cross southbound with their lines conjoined. That suggests the crypto economy may soon fall back into a downward trend if price doesn’t aggressively breach the value line mentioned earlier.
Note: Cryptosignals.org is not a financial advisor. Do your research before investing your funds in any financial asset or presented product or event. We are not responsible for your investing results.
You can purchase crypto coins here. Buy Tokens