Polygon (MATIC/USD) Market Hovers, Exhibits Lower Lows
Estimated Reading Time: 3 minutes
Don’t invest unless you’re prepared to lose all the money you invest. This is a high-risk investment and you are unlikely to be protected if something goes wrong. Take 2 minutes to learn more
Polygon Price Prediction – August 13
Many lengthy failing forces have been exercised by the Polygon trade bulls against the use of the US coin, given that the crypto market operation hovers and exhibits lower lows below a definite bearish path.
The barrier-trading amount has been estimated to be somewhere in the range of $0.70. Before the price improves in valuation enough to raise and sustain the value line, it might take some time. When the price pushes down southward to revisit a support around its most recent lower place, approaching the support line of $0.60, buyers are likely to envision a respectable rebound.
MATIC/USD Market
Key Levels:
Resistance levels: $0.75, $0.85, $0.95
Support levels: $0.60, $0.55, $0.50
MATIC/USD – Daily Chart
The MATIC/USD daily showcases the cryptocurrency market activity as it hovers and exhibits lower lows underneath the trend line of the smaller Moving Average at a close range.
The 14-day SMA indicator is stationed at $0.696 below the $0.770 point of the 50-day SMA indicator. The market’s positions over the past several days have been tentatively rejecting the route of the lighter Moving Average. The Stochastic Oscillators have sprung northward and got repositioned below the value of 80 to move a bit southbound from 70.57 to 67.40.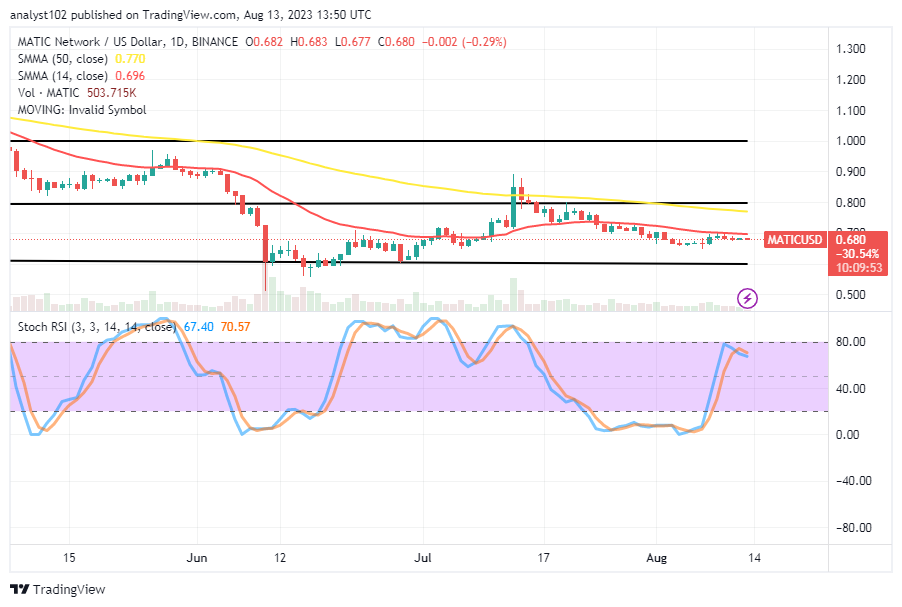
What points of the MATIC/USD market operations are currently causing the most concern?
Buyers and sellers in the MATIC/USD trade activities should now concern themselves with the points of $0.70 and $0.60 as the market hovers and exhibits lower lows around the trade spot of the smaller Moving Average.
Using the Stochastic Oscillators to illustrate a technical reading outlook, long-position investors will need to exercise some patience by waiting until there is an indication of an oversold reading condition before they think about resuming their crypto-economic transaction.
It might be a good time for selling activity to begin around the trend line of the 14-day SMA as long as the overhead barrier spot of the 50-day SMA isn’t broken out to make sustainable upward pushes in the course afterward.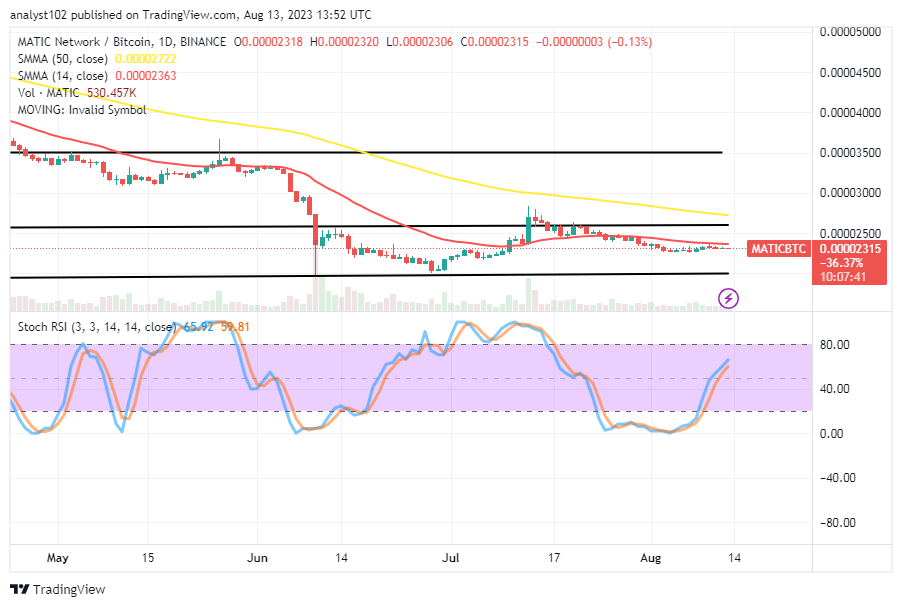
MATIC/BTC Price Analysis
In comparison, Polygon trade activity hovers and exhibits lower lows against Bitcoin, tightly around the trend line of the smaller Moving Average.
The 14-day SMA trend line is positioned closely around the formation of the candlesticks below the 50-day SMA trend line. The Stochastic Oscillators have been able to gain points between 59.81 and 65.92 by moving northward. And before heading in a different direction, they are making a modest attempt to turn for a potential close contact.
Note: Cryptosignals.org is not a financial advisor. Do your research before investing your funds in any financial asset or presented product or event. We are not responsible for your investing results.
You can purchase Lucky Block here. Buy LBLOCK