Chainlink (LINK) Is Stuck below $17, Resumes Selling Pressure
Estimated Reading Time: 2 minutes
Don’t invest unless you’re prepared to lose all the money you invest. This is a high-risk investment and you are unlikely to be protected if something goes wrong. Take 2 minutes to learn more
Chainlink (LINK) Long-Term Analysis: Bearish
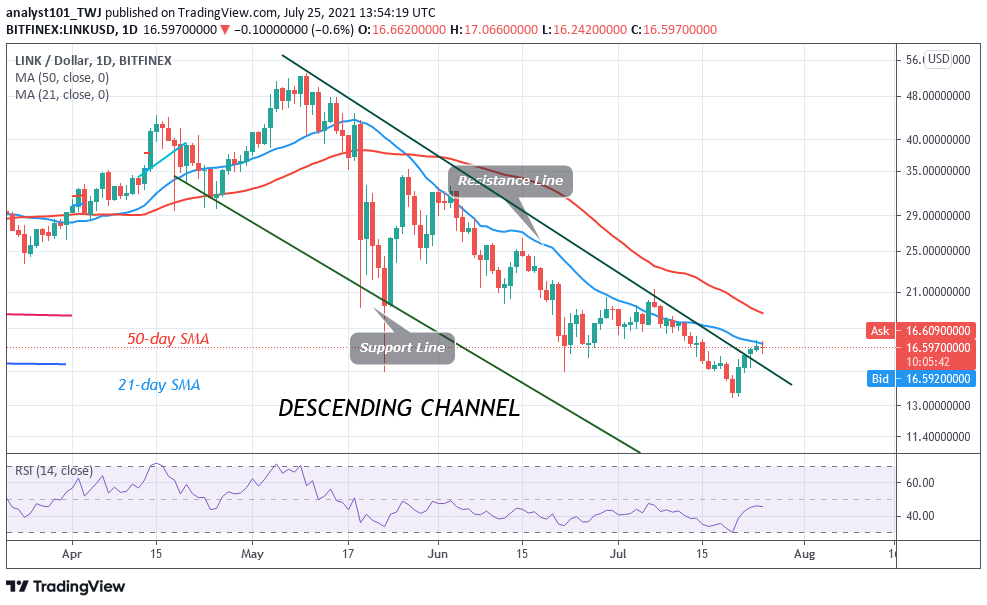
Chainlink’s (LINK) price rallies to $17.50 high but could not break the resistance. After two days of downward correction, the crypto is facing rejection. Chainlink is said to reach the overbought region of the market. Sellers are likely to emerge at the overbought region. The current upward move is doubtful as it faces rejection at the recent high. The previous uptrend is said to be terminated.
Chainlink (LINK) Indicator Analysis
LINK is below the 80% range of the daily stochastic. The crypto is in a bearish momentum. The crypto is at level 44 of the Relative Strength Index period 14. Chainlink is in the downtrend zone and below the centerline 50. The 21-day SMA and 50-day SMA are sloping southward indicating the downtrend.
Technical indicators:
Major Resistance Levels – $60, $62, $ 64
Major Support Levels – $30, $28, $26
What Is the Next Direction for Chainlink (LINK)?
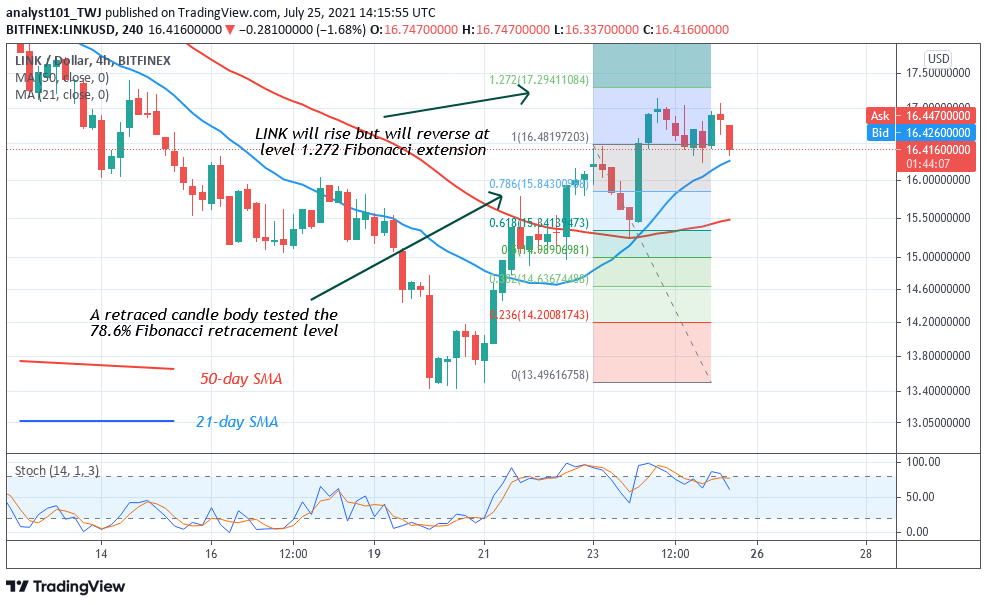
Chainlink is in a downward movement as it faces rejection from the recent move. Meanwhile, on July 23 uptrend; a retraced candle body tested the 78.6% Fibonacci retracement level. This retracement indicates that the market will rise but reverse at level 1.272 Fibonacci extensions or level $17.29. From the price action, the market has reversed close to the 1.272 Fibonacci extensions. It is expected to reach the 78.6% Fibonacci retracement level where its origin.
You can purchase crypto coins here. Buy Tokens
Note: Cryptosignals.org is not a financial advisor. Do your research before investing your funds in any financial asset or presented product or event. We are not responsible for your investing results