ChainLink Decreases as It Falls to a New Low of $6.20
Estimated Reading Time: 2 minutes
Don’t invest unless you’re prepared to lose all the money you invest. This is a high-risk investment and you are unlikely to be protected if something goes wrong. Take 2 minutes to learn more
Chainlink (LINK) Long-Term Analysis: Bearish
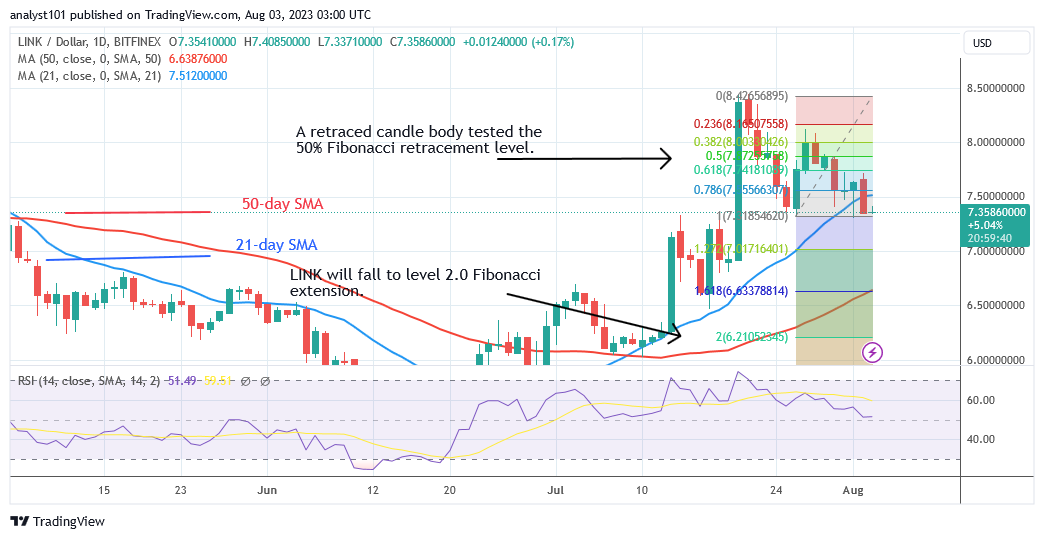
Chainlink (LINK) declines below its 21-day moving average as it falls to a new low of $6.20. The cryptocurrency is falling after being pushed back by the $8.50 resistance level. Today, the altcoin has dropped to a low of $7.35, and the decline is expected to continue. The price indication predicts a further drop to a low of $6.20.
The slump in the price of LINK was rectified on July 26, and the 50% Fibonacci retracement level was tested by the body of a retraced candle. The correction means that LINK will drop to the level of the 2.0 Fibonacci extension, or $6.20. According to the price action, the crypto’s price has broken below the 21-day SMA and is expected to extend to a low above the 50-day SMA.
The selling pressure will become more intense if the price drops below the moving average.
Chainlink (LINK) Indicator Analysis
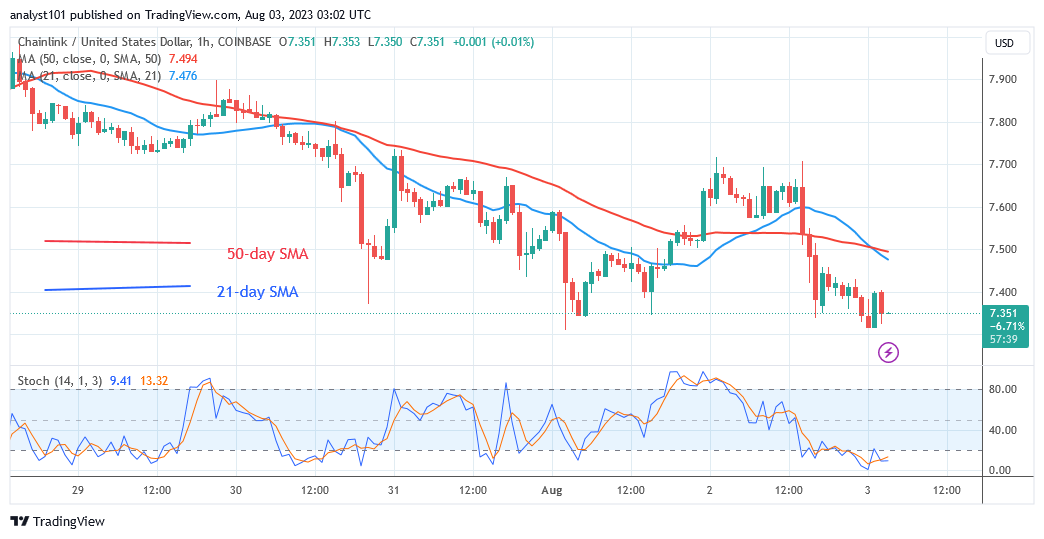
Chainlink is now at the equilibrium level of 51 for the Relative Strength Index period 14. It suggests that demand and supply have reached a balance. As it is trapped, the LINK price will trade between the moving average lines. The coin is in a bearish trend below the daily Stochastic threshold of 20. The fall has reached oversold territory.
Technical indicators:
Major Resistance Levels – $8.00, $10.00, $12.00
Major Support Levels – $6.00, $4.00, $2.00
What Is the Next Direction for Chainlink (LINK)?
Chainlink has renewed selling pressure as it falls to a new low of $6.20. The coin has fallen to the market’s oversold region in the lower time. As the market approaches oversold territory, the bearish trend is expected to fade.
You can purchase crypto coins here. Buy LBLOCK
Note: Cryptosignals.org is not a financial advisor. Do your research before investing your funds in any financial asset or presented product or event. We are not responsible for your investing results