Chainlink Retraces to the $7.20 Breakout Level after Being Overbought
Estimated Reading Time: 2 minutes
Don’t invest unless you’re prepared to lose all the money you invest. This is a high-risk investment and you are unlikely to be protected if something goes wrong. Take 2 minutes to learn more
Chainlink (LINK) Long-Term Analysis: Bullish
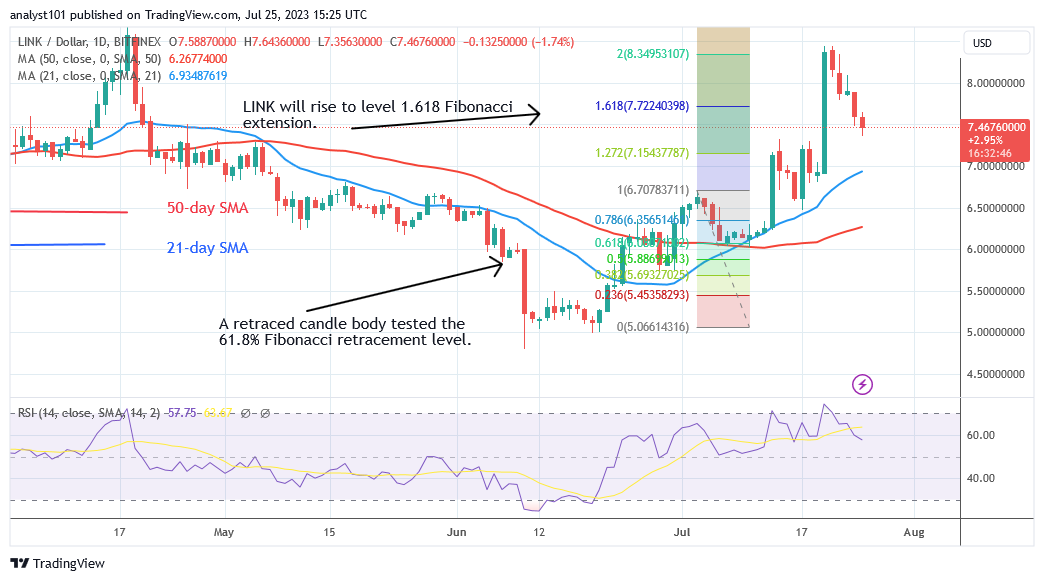
The price of Chainlink (LINK) reaches a high of $8.44 but retraces to the $7.20 breakout level after being overbought. The altcoin is falling as it approaches the market’s overbought zone. On the downside, the market will continue to fall above the $7.20 breakout level or the moving average lines.
If the price retraces and stays above the moving average lines, the present trend will restart. The cryptocurrency will continue to rise and retest the $8.50 resistance level. Once the resistance level is breached, the bullish trend will restart.
If the price falls below the moving average lines, the decline will resume.
Technical indicators:
Major Resistance Levels – $8.00, $10.00, $12.00
Major Support Levels – $6.00, $4.00, $2.00
Chainlink (LINK) Indicator Analysis
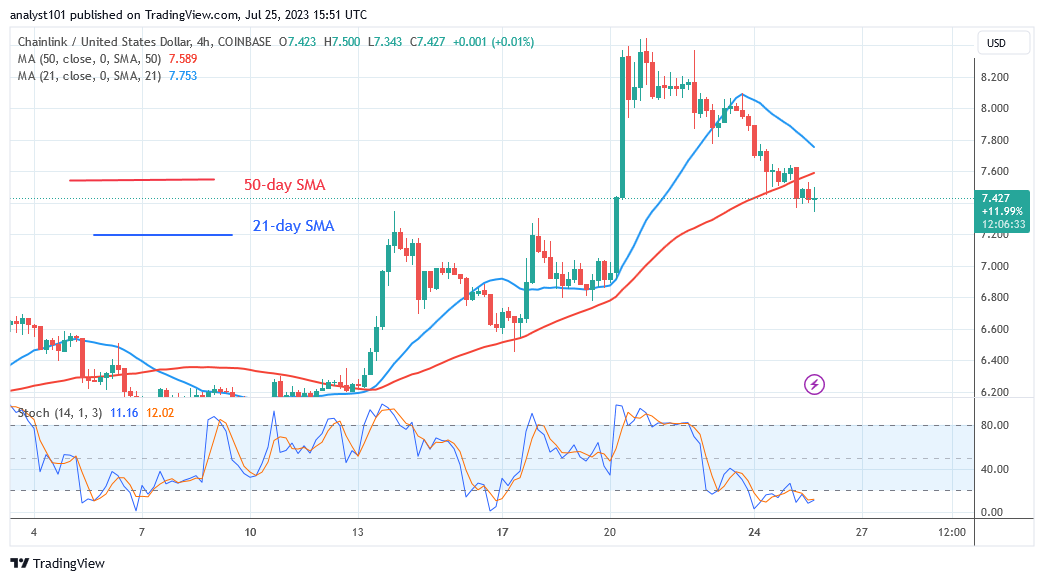
Chainlink has retraced to level 60 of the Relative Strength Index period 14 . The altcoin is on a bullish trend and could rise. The price bars are above the moving average lines, indicating that the altcoin will climb. The coin is trending downward when the daily Stochastic falls below 40.
What Is the Next Direction for Chainlink (LINK)?
Chainlink is above the moving average lines but retraces to the $7.20 breakout level after being overbought. The market’s direction will be defined by whether the price remains above or breaks below the moving average lines. The current rise is expected to continue based on price activity.
You can purchase crypto coins here. Buy LBLOCK
Note: Cryptosignals.org is not a financial advisor. Do your research before investing your funds in any financial asset or presented product or event. We are not responsible for your investing results


