Solana (SOL) Price Prediction: SOL/USDT Sees a Bearish Deflection
Estimated Reading Time: 3 minutes
Don’t invest unless you’re prepared to lose all the money you invest. This is a high-risk investment and you are unlikely to be protected if something goes wrong. Take 2 minutes to learn more

Date: October 3, 2025
The Solana market has been able to overcome the psychological resistance at the $200 price level and has notably advanced upward past the level. However, the market, as of the time of writing, is seeing a modest price decline while staying well elevated to proceed higher subsequently.
Long-Term Trend — Bullish (Daily Chart)
Key Price Levels:
Resistance: $240, $245, $250
Support: $235, $230, $225
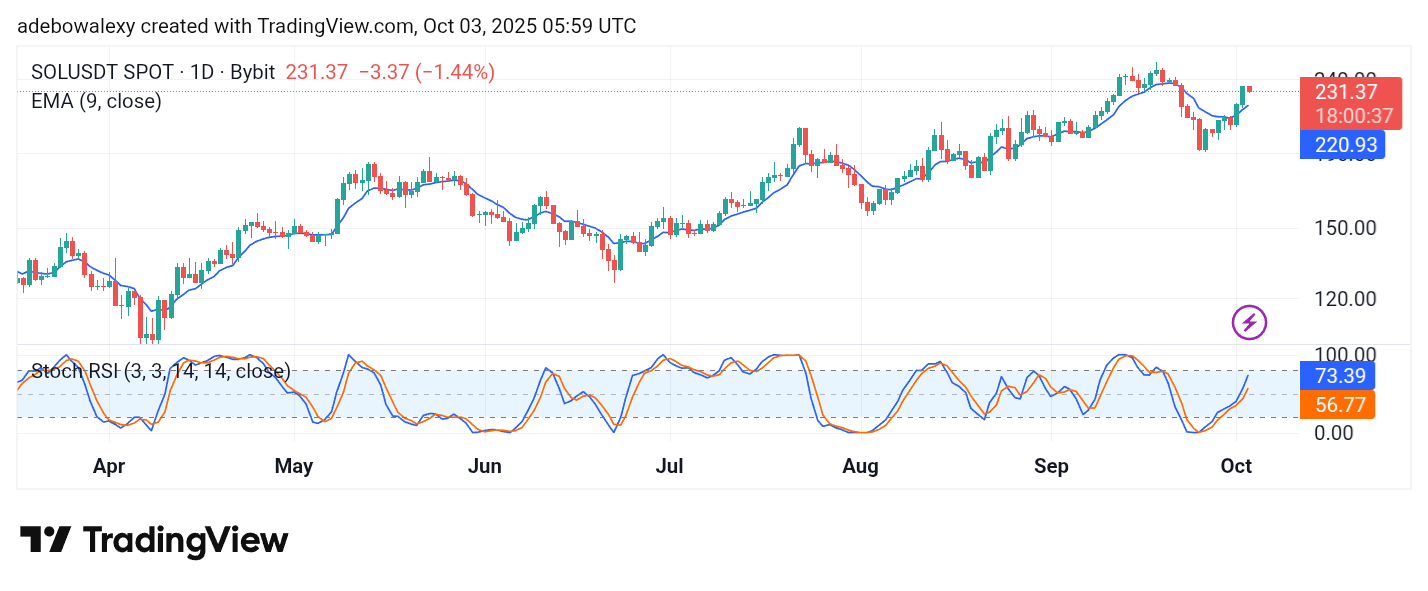
The Solana token has seen a modest pullback today as the market advanced toward the $250 price level. The last candle here is a red, bald price candle. However, it stands at a significant distance above the 9-day Exponential Moving Average (EMA) line.
Also, the Stochastic Relative Strength Index (SRSI) indicator lines are still pointing straight into the overbought region without a deflection on either of its lines. The lead line is at the 73.39 mark, while the lagging line of the indicator stands at 56.77.
Solana (SOL) Price Prediction: Solana Bulls Retain Much Dominance
The Solana market has seen a sizeable amount of upward retracement over the past sessions. The recent trend in this market resulted when price action tested the support at the $180 mark. At this point, price action has moved past the 9-day EMA curve, even with the ongoing session presenting a modest downward correction.
Meanwhile, the SRSI indicator line continues its upward path into the overbought region. It could be noticed that the ongoing downward deflection is yet to be reflected on the indicator. This communicates that upside forces are largely dominant until further proven otherwise.
Solana (SOL) Price Prediction: SOL/USDT Downward Retracement Stays at Bay (4-Hour Chart)
While the downward retracement in the Solana 4-hour market has continued for the second session, one thing stays evident: downward progress remains limited. The ongoing session stays in the red but presents little bearish progress.
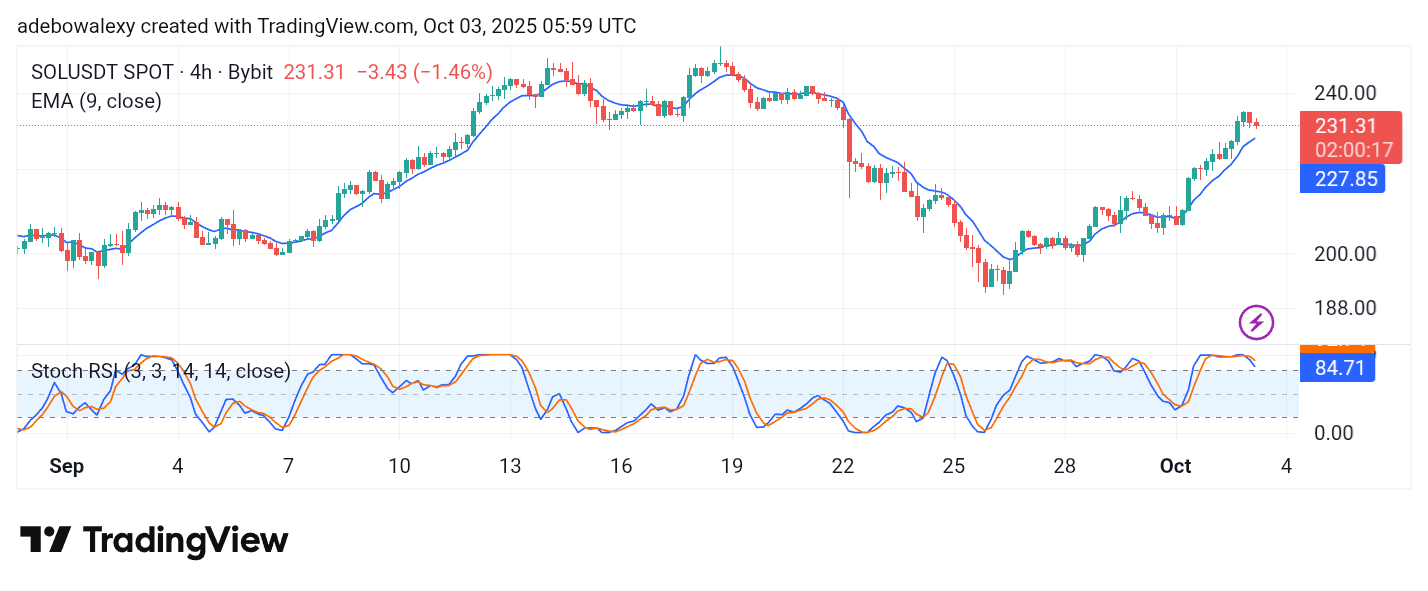
As a result, trading activity remains at a significant distance above the 9-day EMA line. Simultaneously, the lines of the SRSI indicator stand in the overbought region but have a downward trajectory toward the 80 mark. Nevertheless, since price action stands at a good distance above the 9-day EMA curve, trading activity may proceed upward toward the $245 price level.