Solana (SOL) Price Prediction: SOL/USDT Drops Below the $200 Mark
Estimated Reading Time: 2 minutes
Don’t invest unless you’re prepared to lose all the money you invest. This is a high-risk investment and you are unlikely to be protected if something goes wrong. Take 2 minutes to learn more

Date: September 26, 2025
The Solana market has been tumbling ever since it attempted to breach resistance at the $250 price level. Even the psychological support at the $200 level couldn’t hold, and the token now trades below that mark.
Long-Term Trend — Bullish (Daily Chart)
Key Price Levels:
Resistance: $200, $210, $220
Support: $195, $190, $180
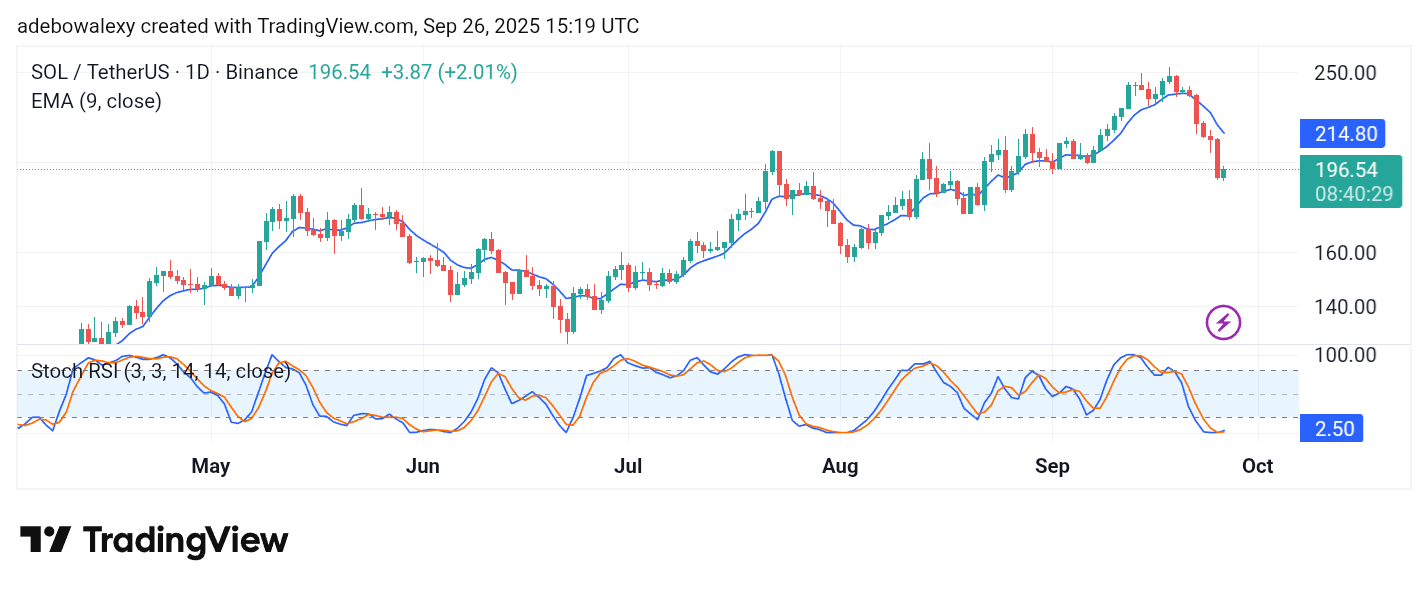
As mentioned earlier, price action in the Solana market has fallen below key technical levels. The ongoing session, however, has produced an upward bounce, albeit still positioned below the 9-day Exponential Moving Average (EMA) curve. At the same time, the Stochastic Relative Strength Index (SRSI) line is now below the 10 mark of the indicator. A closer look at the terminal of the indicator, however, reveals a slight upward tilt.
Solana (SOL) Price Prediction: Bears Retain an Overpowering Presence in the SOL/USDT Market
The ongoing session in the Solana market holds a minor bullish stance. This stand, however, appears weak and overwhelmed by bearish sentiment. The current session is taking place at a significant distance below the 9-day EMA line.
Meanwhile, the SRSI lines are merged and deep in the oversold region. Coupled with the fact that the last price candle lies significantly below the EMA line, bearish pressure still has the upper hand and may continue to drive the market lower.
Solana (SOL) Price Prediction: SOL/USDT Remains Largely Subdued (4-Hour Chart)
Even on the 4-hour chart, price action has remained below the 9-day EMA curve. The last price candle on this chart is green but carries visible upper and lower shadows, suggesting tension within the session.
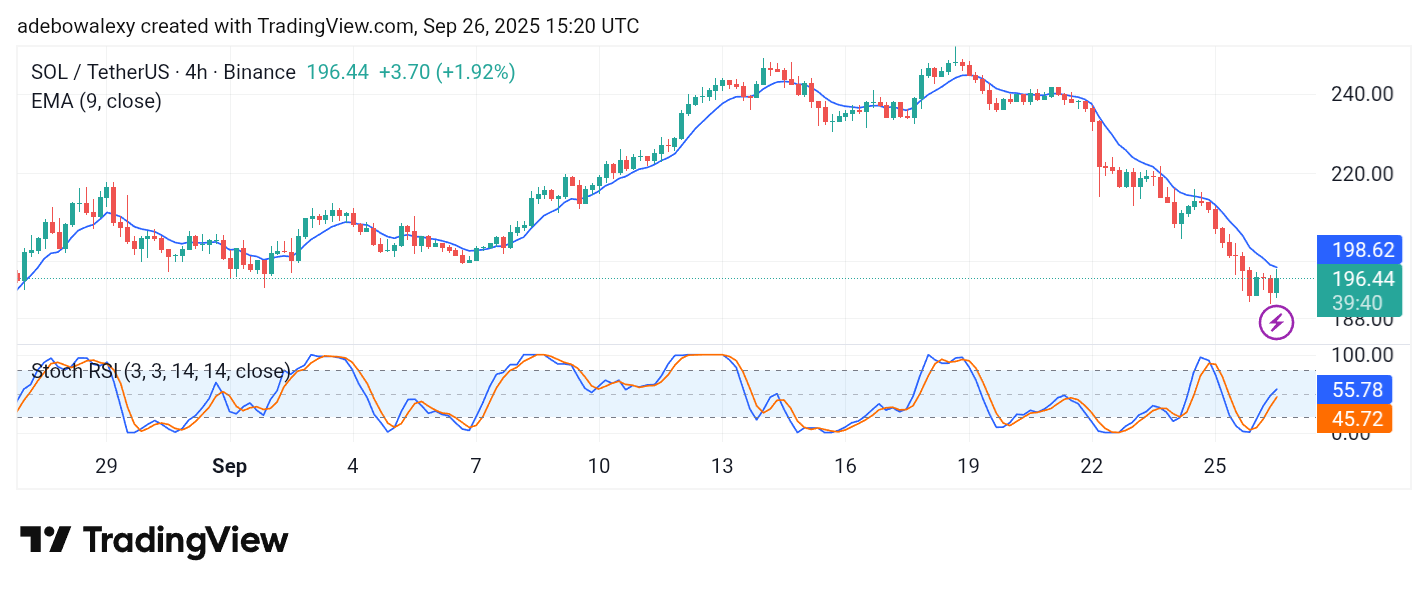
The SRSI lines are on an upward trajectory, rising toward the overbought region. However, with the lead line now above the 50 threshold, this movement appears exaggerated. As such, the bullish attempt still looks weak. Therefore, traders may need to wait until price action secures support above the $200 mark before taking a stronger bullish stance.