Ethereum (ETH/USD) Price Trades in $3,500 and $3,000 Ranges
Estimated Reading Time: 3 minutes
Don’t invest unless you’re prepared to lose all the money you invest. This is a high-risk investment and you are unlikely to be protected if something goes wrong. Take 2 minutes to learn more
Ethereum Price Prediction – September 13
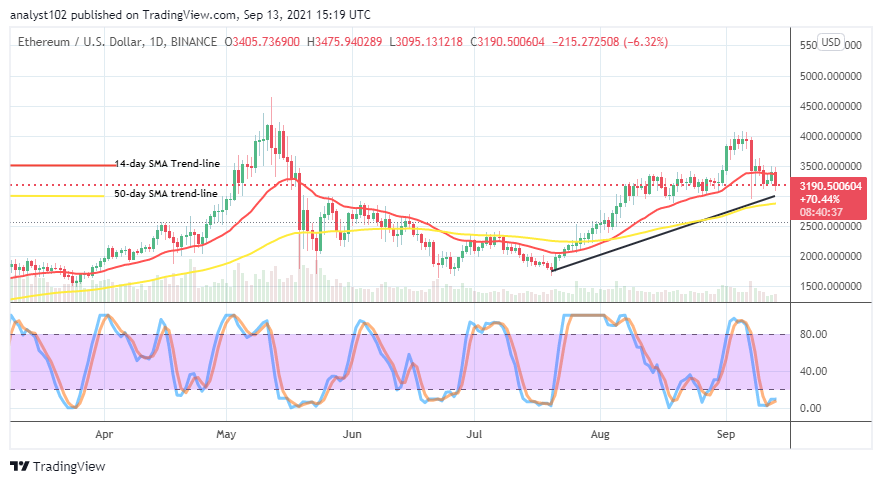
The ETH/USD price trades in $3,500 and $3,000 ranges since the last time it witnessed a decline in valuation. The crypto market makes a record of a percentage rate of around -6.32, trading at a level of about $3,190. The downward forces seem to be dominating the market relatively as of writing.
ETH/USD Market
Key Levels:
Resistance levels: $3,500, $3,750, $4,000
Support levels: $3,000, $2,750, $2,500
ETH/USD – Daily Chart
The ETH/USD daily chart exhibits the crypto-economic price trades in $3,500 and $3,000 ranges as a line of candlesticks has formed to indicate the degrees of ups and downs. The 14-day SMA trend line is closer beneath the higher value range above the 50-day SMA trend line. The bullish trend line drew around the trend line of the bigger SMA to place a supportive mark at the lower value range line. The Stochastic Oscillators are in the oversold region, seemingly striving to cross the lines back northbound.
Has the ETH/USD entered back into a range-bound trading situation as price trades in $3,500 and $3,000?
It appears that the ETH/USD market has again entered another round of range-bound trading situations as the crypto’s price trades in $3,500 and $3,000 ranges presently. It would be more technically ideal that bulls stay on the lookout for the possibility of getting a decent entry to launch a buy position when the market’s active downward motion appears to show a sign of exhaustion around the lesser value point mentioned earlier.
On the downside, it would be safe that the ETH/USD market bears be on the lookout for the possibility that price can be resisted around the higher range line at $3,500 before a re-launch of sell order could be. The reading of the Stochastic Oscillators suggests that the downward force, breaking down the lower range line, lacks sustainability.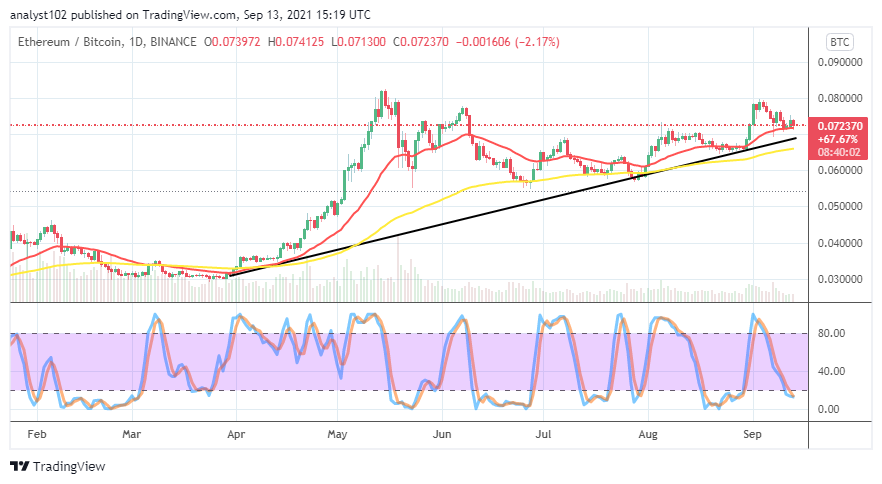
ETH/BTC Price Analysis
In comparison, it also depicted on the ETH/BTC price analysis chart that the cryptocurrency pair’s price trades in ranges while a correction is made. All the indicators yet point toward the north. The 14-day SMA trend line is above the 50-day SMA trend line as the bullish trend line is a supportive trading tool to the smaller SMA. Candlesticks have gently formed southward to touch the smaller SMA, denoting a high level. That shows that base crypto still somewhat possesses the trending capability in the market more than the flagship cryptocurrency.
Note: Cryptosignals.org is not a financial advisor. Do your research before investing your funds in any financial asset or presented product or event. We are not responsible for your investing results.
You can purchase crypto coins here. Buy Tokens

