Solana (SOL) Price Prediction: SOL/USDT Holds Steady Above the $240 Level
Estimated Reading Time: 2 minutes
Don’t invest unless you’re prepared to lose all the money you invest. This is a high-risk investment and you are unlikely to be protected if something goes wrong. Take 2 minutes to learn more

Date: September 19, 2025
The upside movement in the Solana market has continued. As it stands, it appears the market has found support above this price region. Yet trading indicators are still suggesting that upside forces are likely to retain their dominance in this market.
Long-Term Trend — Bullish (Daily Chart)
Key Price Levels:
Resistance: $250, $255, $260
Support: $240, $235, $230
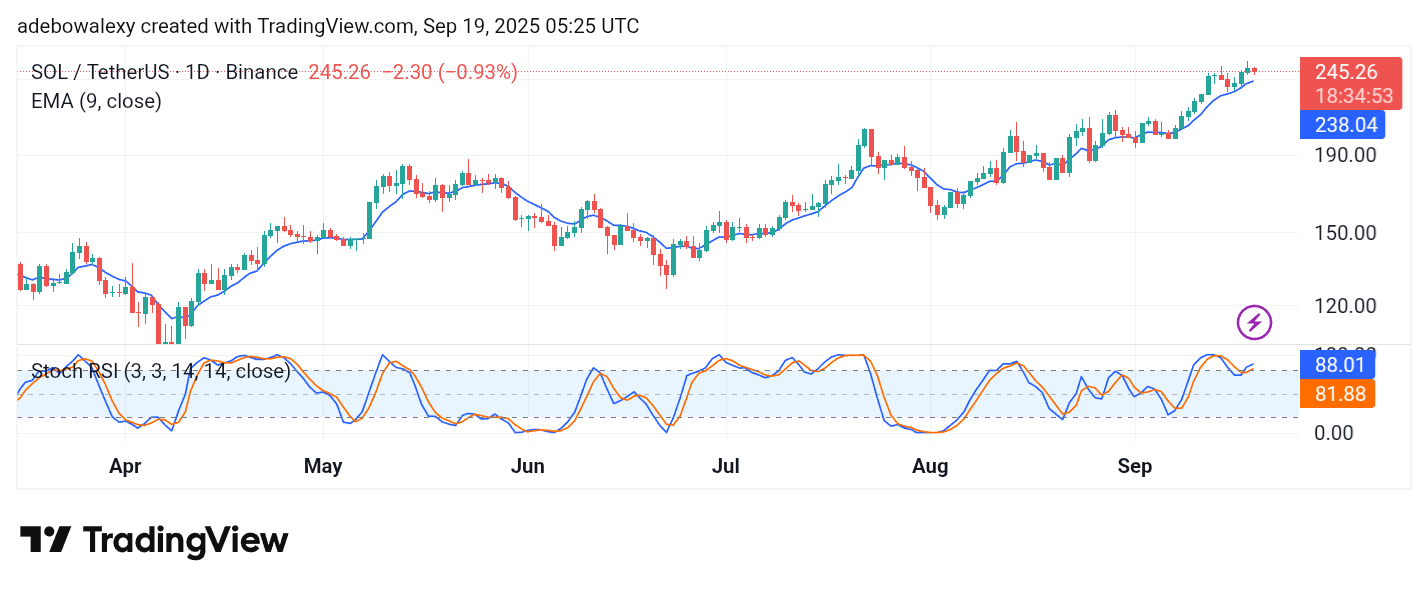
Price movement in the Solana daily chart has continued in its upward path over the week. The ongoing session stands above the 9-day Exponential Moving Average (EMA) line and is represented by a red price candle. Despite the bearish appearance of the corresponding price candle in the ongoing session, the line of the Stochastic Relative Strength Index (SRSI) indicator stays generally projected upward and remains in the overbought zone.
Solana (SOL) Price Prediction: SOL/USDT Upside Correction Stays Largely on Track
The fact that price activity in the Solana daily chart remains above the 9-day EMA curve suggests that in the meantime buyers have had the most impact. Meanwhile, the ongoing session, through the appearance of the corresponding price candle, indicates that some traders are already taking profits.
However, this appears minimal, and the market still has what it takes to keep pushing upward. The behavior of the SRSI indicator lines also supports this outlook for a continued upward movement in this market, seeing that they stay generally projected upward.
Solana (SOL) Price Prediction: SOL/USDT Finds Support at a Key Technical Level (4-Hour Chart)
The ongoing session has appeared as a green price candle with its open settling just above the 9-day EMA curve. Meanwhile, the market has seen a downward retracement over the past two sessions, but the current session shows that support is at the $244 price level.
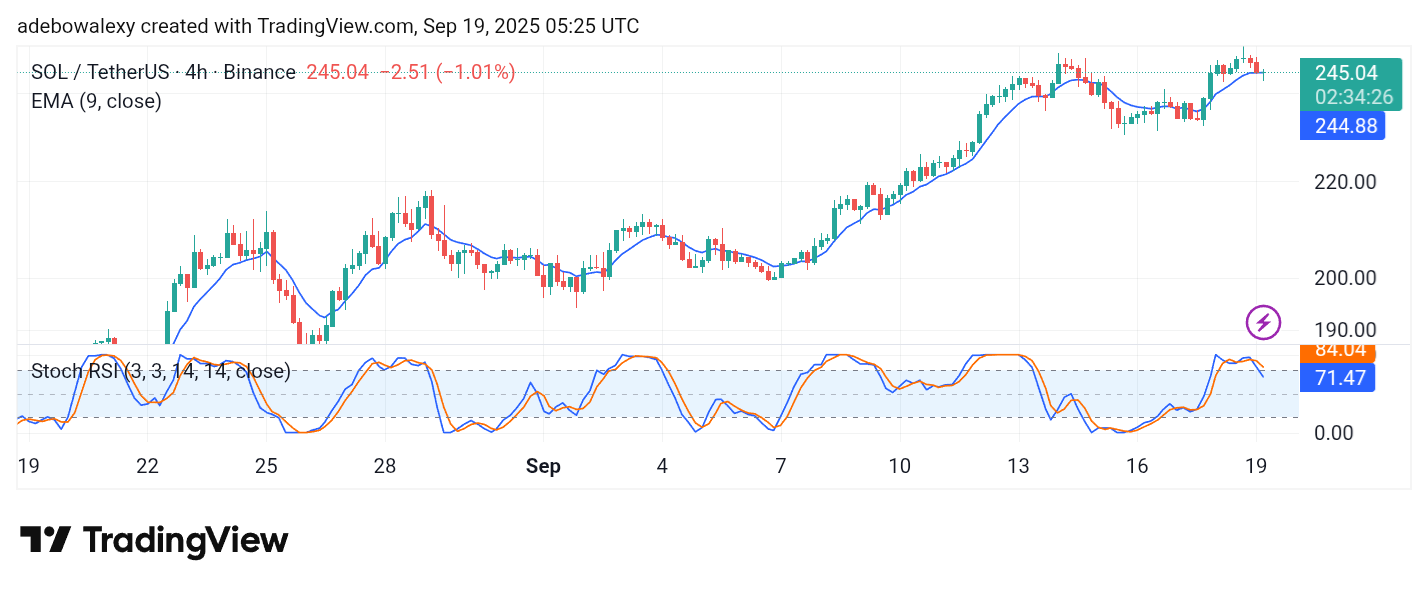
The lines of the SRSI indicator are falling toward lower thresholds. The lead line has fallen through the 80 level, but the lagging line still stands above the 80 level. However, should the support at the $244 price level hold, we may see the market proceed upward toward the $248 and $250 price levels.