Quant Price Prediction: QNT/USD Keeps Moving Sideways as More Buyers Are Expected
Estimated Reading Time: 3 minutes
Don’t invest unless you’re prepared to lose all the money you invest. This is a high-risk investment and you are unlikely to be protected if something goes wrong. Take 2 minutes to learn more
Quant Price Prediction – November 21
The Quant price prediction shows that QNT will soon recover to the upside as the bulls get ready for a cross above the moving averages.
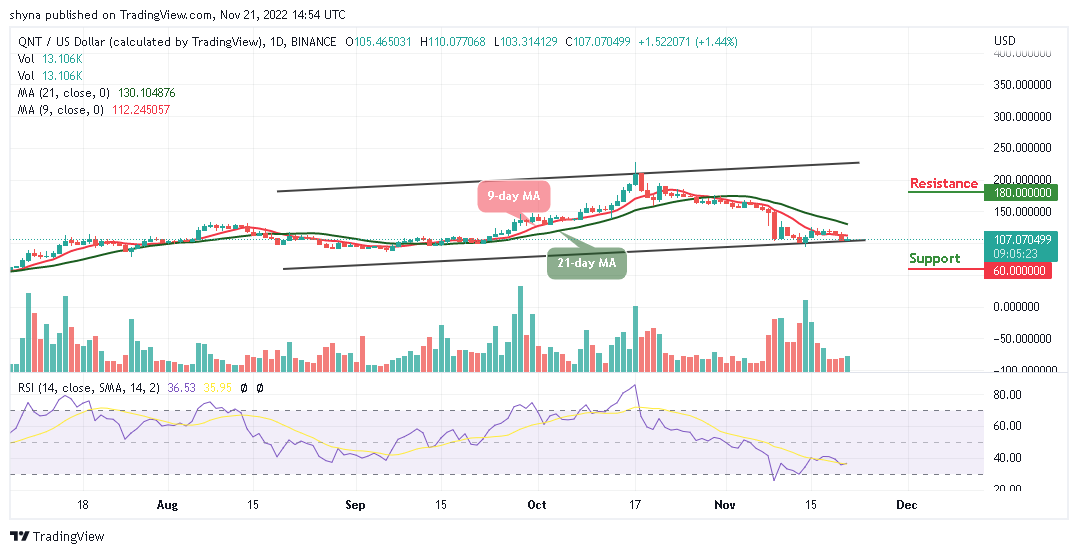
QNT/USD Medium-term Trend: Ranging (1D Chart)
Key Levels:
Resistance levels: $180, $200, $220
Support levels: $60, $40, $20
QNT/USD will begin to face the upside as the buyers regroup around the 9-day and the 21-day moving average. However, the price of the coin is very low, therefore, new and existing buyers are expected to invest heavily. Meanwhile, should the bulls fail to push the price upward, the Quant price may move sideways before heading to the upside.
Quant Price Prediction: QNT/USD Will Shoot to the Upside
Looking at the daily chart, the Quant price would break towards the upper boundary of the channel as soon as the buyers resume fully into the market. However, any bullish movement above the 21-day moving average will push the price to the potential resistance levels of $180, $200, and $220.
In other words, the bullish movement may be delayed if the Quant price crosses below the lower boundary of the channel. Any further bearish movement to the downside could touch the support levels of $60, $40, and $20 respectively. Meanwhile, the technical indicator Relative Strength Index (14) is showing a possible bullish movement as the signal line moves below the 40-level.
QNT/USD Medium-term Trend: Ranging (4H Chart)
Looking at the 4-hour chart, the Quant price keeps hovering below the 9-day and 21-day moving averages as the buyers move to push the coin above the 9-day and 21-day moving averages. Any further bullish movement above the upper boundary of the channel could touch the major resistance level at $120. However, crossing above this level could locate the potential resistance at $135 and above.

Moreover, the technical indicator Relative Strength Index (14) is heading to the north, indicating that bullish signals are coming to play out. On the contrary, should the bulls fail to move the current market value to the upside, the bears may step back into the market, and the nearest support level could be found at $80 and below.
Place winning Quant trades with us. Get QNT here