Cardano (ADA/USDT) Moves Below $0.7488 as Losses Add Up
Estimated Reading Time: 3 minutes
Don’t invest unless you’re prepared to lose all the money you invest. This is a high-risk investment and you are unlikely to be protected if something goes wrong. Take 2 minutes to learn more
Cardano Long-term Analysis: Bearish
Cardano against the Tether after a sharp and significant bullish rally above $1.000 in the previous trading session has dropped from its zenith. However, bearish traders seem to be dragging the price to the south as the pair records more losses.
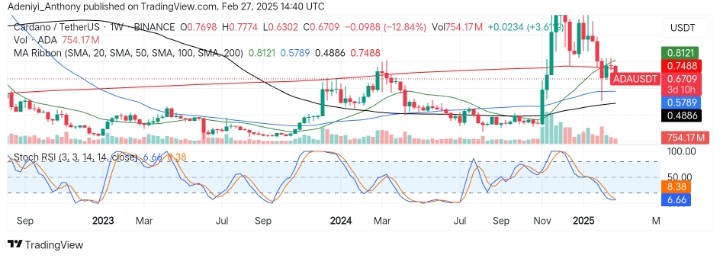
Recently, during the weekly timeframe, Cardano bullish traders appeared to be pushing the price to the north, as seen in the formation of a green candlestick. Currently, the price is below key moving average lines. However, this hints at a further downtrend. However, the curvature of the Stochastic RSI indicates price may find its way back to the north soon.
Currently, Cardano trades at $0.6709, with an impressive 754.17 million traded volumes.
Technical Indicators
Major Resistance Levels: $0.7500, $0.8121, and $1.0000
Major Support Levels: $0.5789, $0.4886, and $4.0000
Cardano Technical Analysis
The analysis of Cardano against Tether on a weekly timeframe shows that the pair has been breaking supports since the beginning of the year as the 20-period and the 200-period moving averages lie above the price. This suggests ADA acts under strong selling pressure with the 50-period and the 100-period moving averages acting as the immediate supports.
On the other hand, the Stochastic RSI signals a strong selling pressure. However, the positioning of the lines indicates the pressure may be waning, suggesting the pair might record a short-term gain in the near term.
To this end, the extent to which the gain will be recorded depends on the ability of the bullish traders to hold the price above $0.7482 for a higher position.
ADA/USDT Analysis: Where from Here?
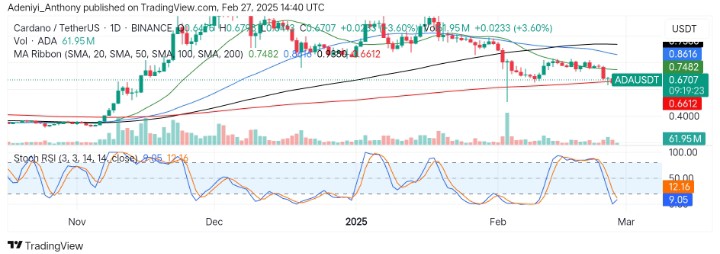
On the daily timeframe, ADA/USDT appears to be rebounding towards the 20-day average line, which lies ahead. However, the oscillator indicates strong selling pressure despite the curvature of the lines. This signals the pair may record an upside movement provided bullish traders enter the market; otherwise, the pair may resume a downtrend.
To this end, ADA aims at $0.7482 for a bullish reversal; otherwise, a drop below $0.6612 might signal a move toward the 0.600 support level.
You can purchase crypto coins here. Buy LBlock